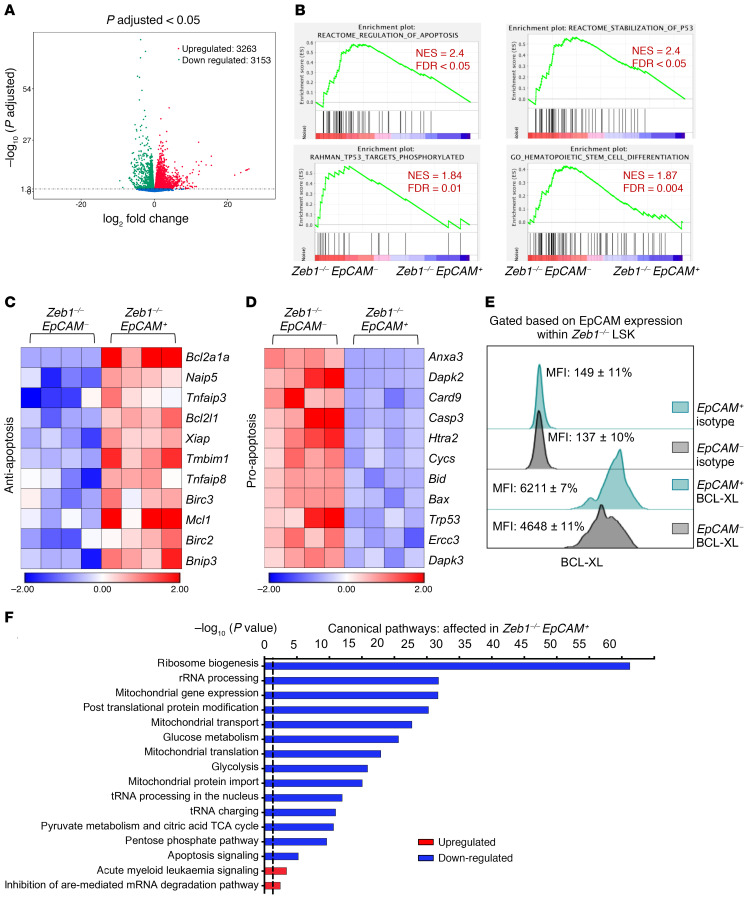
Figure 7. Zeb1–/– EpCAM+ HSPCs display enhanced cell survival and diminished mitochondrial metabolism, RNA biogenesis, and differentiation transcriptional signatures.
(A) Volcano plot showing the relationship between magnitude of gene expression change (log2 of fold-change; x axis) and statistical significance of this change (–log10 of adjusted P value; y axis) in a comparison of Zeb1–/– EpCAM+ to Zeb1–/– EpCAM– LSK cells. Colored points represent DEGs (cutoff FDR < 0.05) that are either overexpressed (red) or underexpressed (green) in Zeb1–/– EpCAM+ compared with Zeb1–/– EpCAM–. (B) GSEA plots of regulation of apoptosis, stabilization of P53, TP53 targets phosphorylated, and HSC differentiation. Heatmaps of the DEGs within EpCAM+ and EpCAM– LSK after Zeb1 deletion related to antiapoptosis (C) and proapoptosis (D). (E) Representative histogram of BCL-XL levels in EpCAM fractions within Zeb1–/– LSK. (F) Canonical pathways that were mostly enriched in Zeb1–/– EpCAM+ LSK cells derived from the IPA, BioCarta, KEGG, PID, and Reactome pathway databases. Data are shown as –log10 (P value), and the dashed black line indicates P value of 0.05. Analysis was performed using the GSEA software and IPA.

