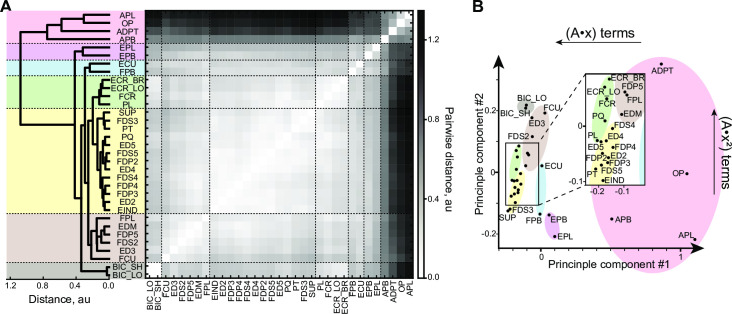
Fig 6. Kinematic muscle invariants.
A. Average-linkage dendrogram computed from the heatmap of pairwise distances between muscle invariants. Horizontal dashed lines indicate subgroups described in text. B. The representation of muscle invariants in the space of their main two principle components. Insert: expanded view of a portion of the plot. The prevalence of linear and quadratic terms in polynomials is reflected within the principal directions (shown with arrows).

