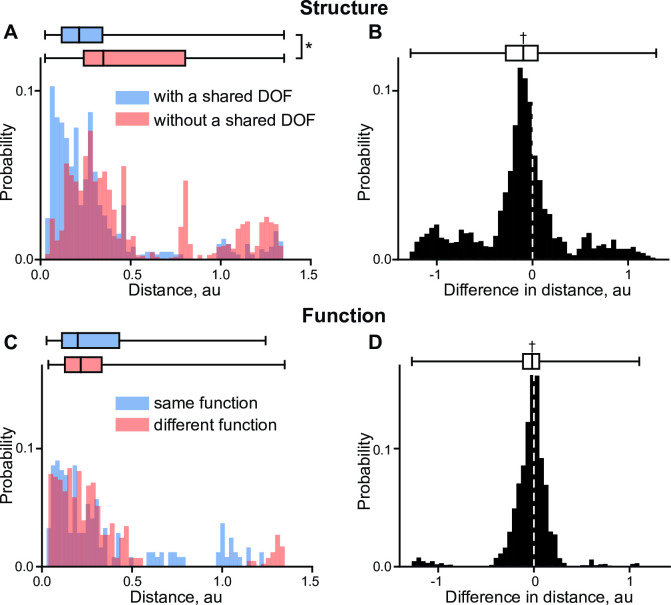
Fig 7. The structural and functional information embedded in muscle invariants.
A. The probability distributions of observing the distance between the pairs of muscle invariants with (blue) and without (red) a shared DOF. B. The test of difference between the two groups. C. The probability distributions of the distance between the pairs with the shared structural information and with (blue) and without (red) shared functions. D. The test of difference between the two groups. Box plots indicate a median and 25th-75th quantile region. The significant differences between the overlap of distributions tested with Mann-Whitney U test is marked with (*). The sign test significance is marked with (†).

