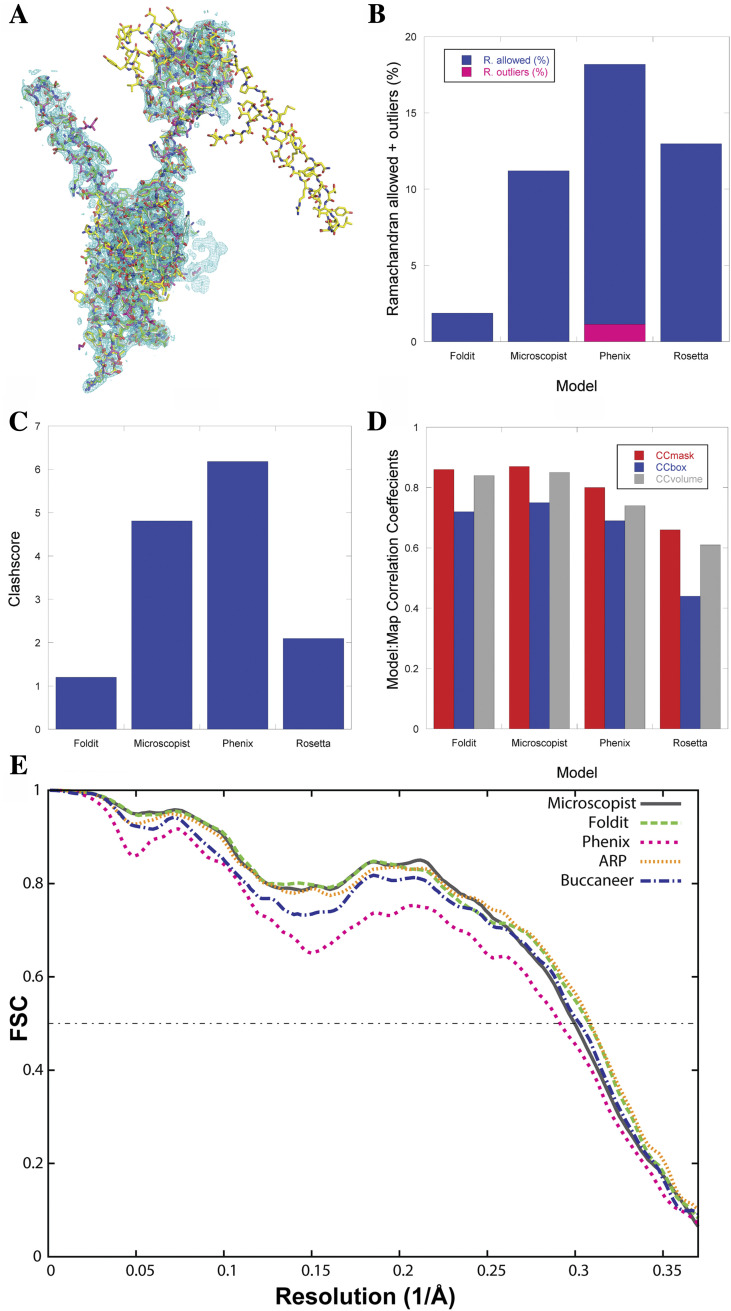
FIG. 12.
(a) Comparison of models for Afp7. The Foldit structure is rendered in green, the microscopist structure in gray, the Phenix model in magenta, and the Rosetta model in yellow. The electron potential map is contoured at 2σ. (b) Comparison of the Ramachandran outlier and allowed backbone conformations. (c) Comparison of Molprobity Clashscore—in both cases, lower is better. (d) Comparison of three different map-to-model correlation coefficients in which higher values are better. (e) Map-to-model FSC curves for Microscopist (gray), Foldit (green), Phenix (pink), ARP w/ARP (orange), and Buccaneer (blue) models. Reprinted with permission from Khatib et al., PLoS Biol. 17(11), e3000472 (2019). Copyright 2019.

