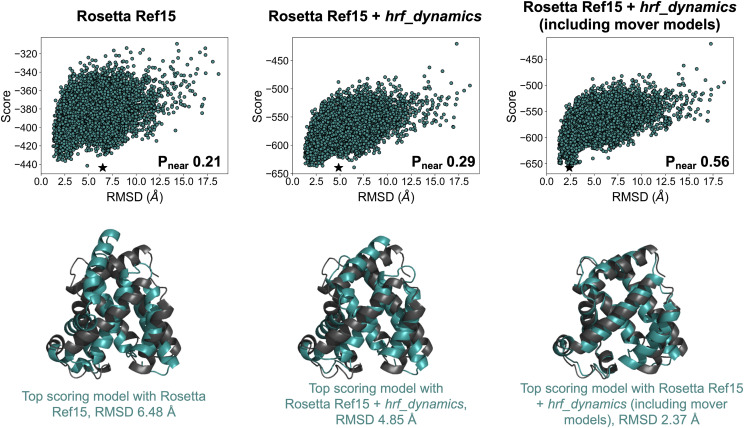
FIG. 6.
The inclusion of HRF data improved structure prediction for myoglobin. Top shows score vs RMSD plots and quality of funneling metric, Pnear, for 20 000 ab initio models (top scoring model for each shown with a star). Bottom shows a comparison of top scoring model (cyan) to the crystal structure (gray). Results are shown for when no HRF data were included (left), when hrf_dynamics score was included (middle), and when hrf_dynamics score was included with further sampling using Rosetta movers for the top 20 models (right). Figure credit: Sarah Biehn.

