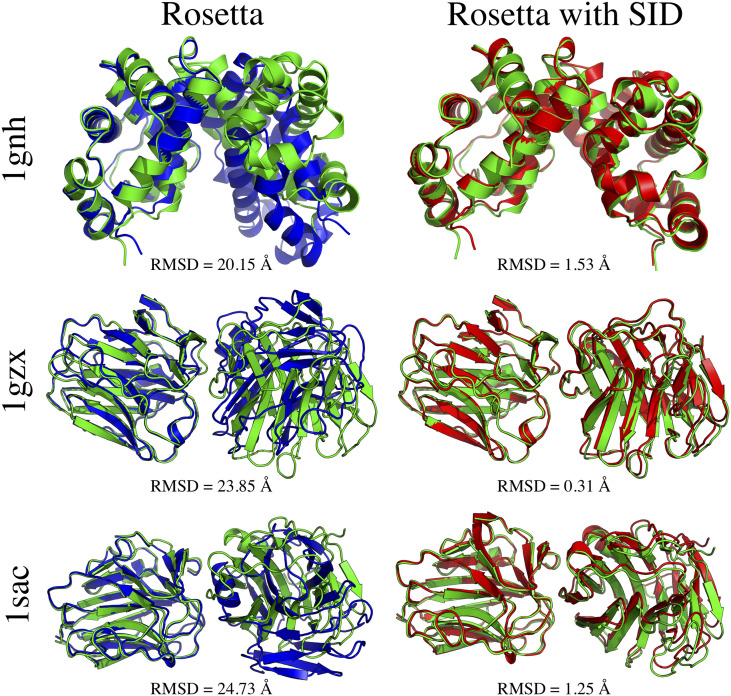
FIG. 7.
Comparison of predicted subcomplexes with (left, blue) and without (right, red) the inclusion of SID data into protein–protein docking. The native structures are shown for reference (green). RMSD (Å) to the mobile chain is shown. RMSD improved by >18 Å when SID data were included for these cases. Reprinted with permission from Seffernick et al., ACS Cent. Sci. 5(8), 1330–1341 (2019). Copyright 2019 American Chemical Society (ACS). Further permissions related to the material excerpted should be directed to the ACS.

