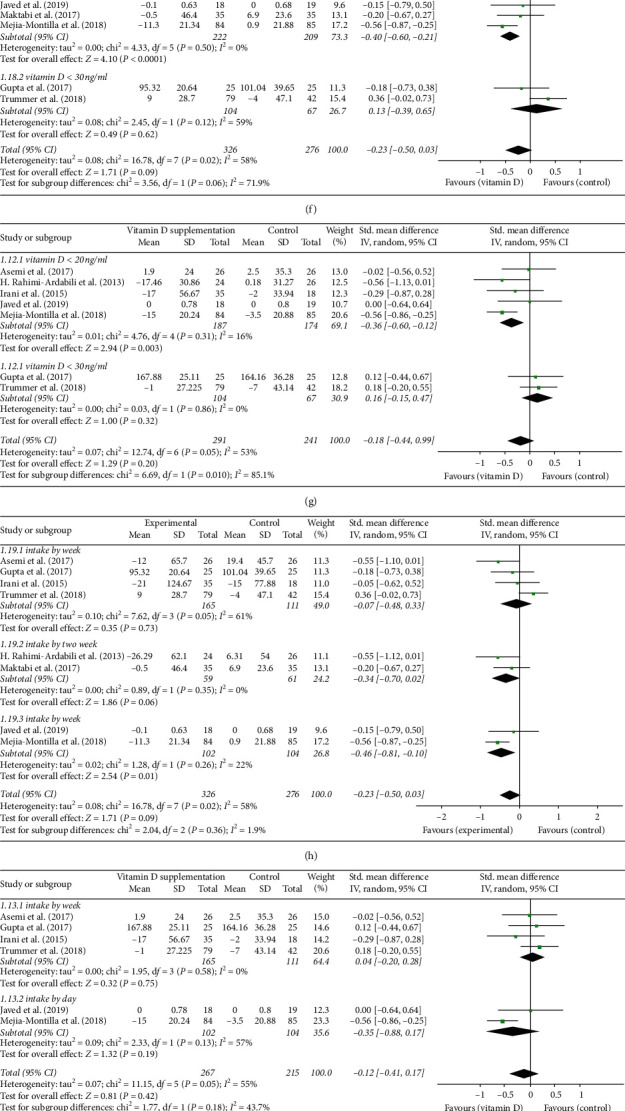
Figure 6.

(a) Forest plot of total-C level in experimental and placebo groups. (b) Forest plot of LDL-C level in experimental and placebo groups. (c) Forest plot of VLDL-C level in experimental and placebo groups. (d) Forest plot of HDL-C level in experimental and placebo groups. (e) Forest plot of triglycerides in experimental and placebo groups. (f) Forest Plot of triglycerides in women with PCOS who have vitamin D deficiency or insufficiency. (g) Forest plot of total-C in women with PCOS who have vitamin D deficiency or insufficiency. (h) Forest plot of triglycerides in women PCOS supplemented by day, week, two weeks, and 20 days. (i) Forest plot of total-C in women with PCOS supplemented by day, week, and 20 days. (j) Forest plot of triglycerides in women with PCOS supplemented with a low or high dose. (k) Forest plot of total-C in women with PCOS supplemented with a low dose or high dose. (l) Forest plot of LDL-C in women with PCOS supplemented with a low dose or high dose.
