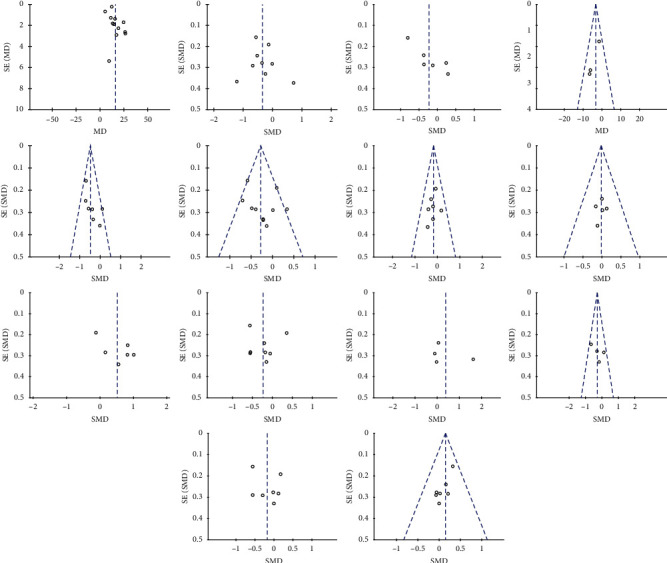
Figure 8.

Funnel plot of standard error by standard differences in the means of plasma: (a) vitamin D; (b) FPG; (c) fasting insulin; (d) HOMA-IR; (e) QUICKI; (f) triglycerides; (g) total-C; (h) HDL-C; (i) LDL-C; (j) VLDL-C; (k) total testosterone; (l) DHEAS; (m) SHBG; (n) hs-CRP in selected trials.
