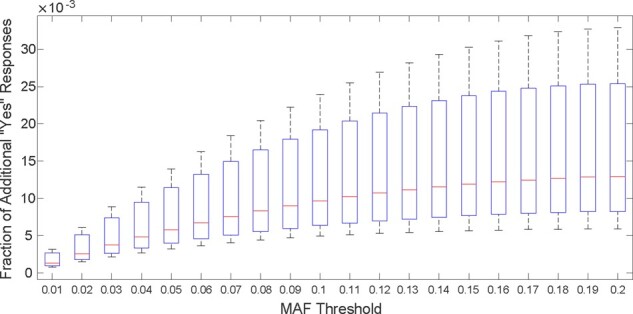
Fig. 6.

The utility loss of the beacon responses considering the SNPs with low MAF values. The box plots show the fraction of additional ‘yes’ responses that arise due to the addition of synthetically generated family members for 20 cases when the mother of each victim is added to the beacon one-by-one independently. The x-axis shows various MAF thresholds. For each x value, all SNPs with an MAF value less than that threshold are considered
