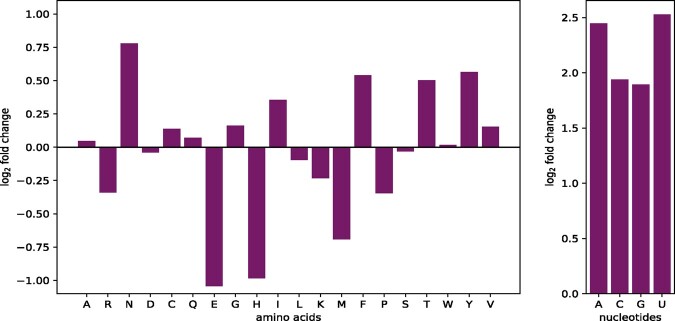
Fig. 1.
FC differences in amino acid and nucleotides usage. The stoichiometric coefficients of the alveolar macrophage biomass maintenance function and the VBOF are compared using Equation (1). The left panel displays the FC of all 20 proteinogenic amino acids. The one letter code of the amino acids is used for labeling the x-axis. The right panel displays the FC of the four RNA nucleotides. The one letter code of the RNA nucleotides is used for labeling the x-axis

