
Figure 3.
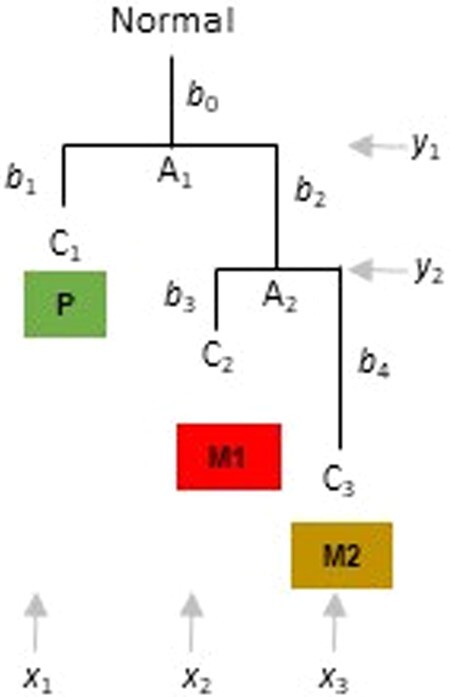
A phylogeny of three clones (C1, C2 and C3) found in three tumors (P, M1 and M2, respectively). Clone relationships with branch lengths (b’s) are shown, along with the locality in which each clone is found. A1 and A2 are the ancestral clones, and “Normal” refers to the germline/non-cancer cell sequence.