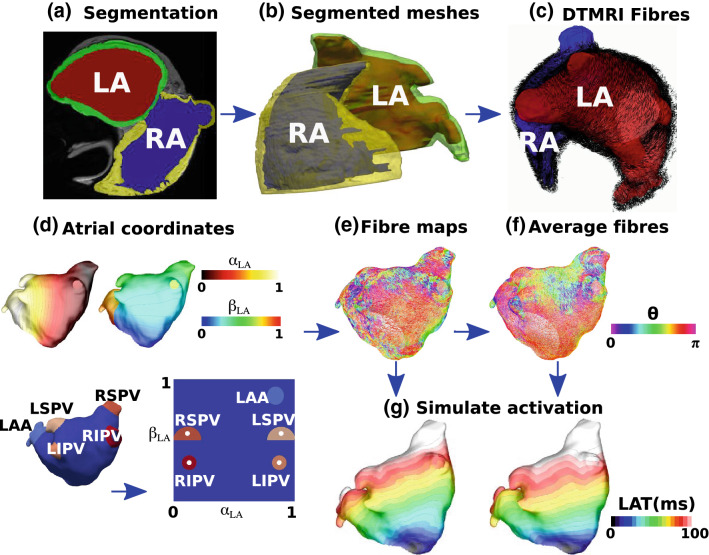
Figure 1.
Atlas from DTMRI data. (a) MRI data were segmented to give the LA blood pool (red), the LA wall (green), the RA blood pool (blue) and the RA wall (yellow). (b) The left and right endocardial and epicardial surfaces were meshed. (c) DTMRI fibres were extracted for each of the LA and RA. (d) Atrial coordinates were calculated (shown here for the LA) and used to express each atrium in a 2D coordinate system. (e) Fibres were expressed in the UAC basis, with a UAC fibre angle. (f) Fibre fields from each of the left or right atrial endocardial or epicardial shells were registered to a common shell using UAC and an average fibre field was calculated. (g) Simulations were run to evaluate the effects of fibre field on activation time maps (examples shown here correspond to the fibre fields in (e) and (f).

