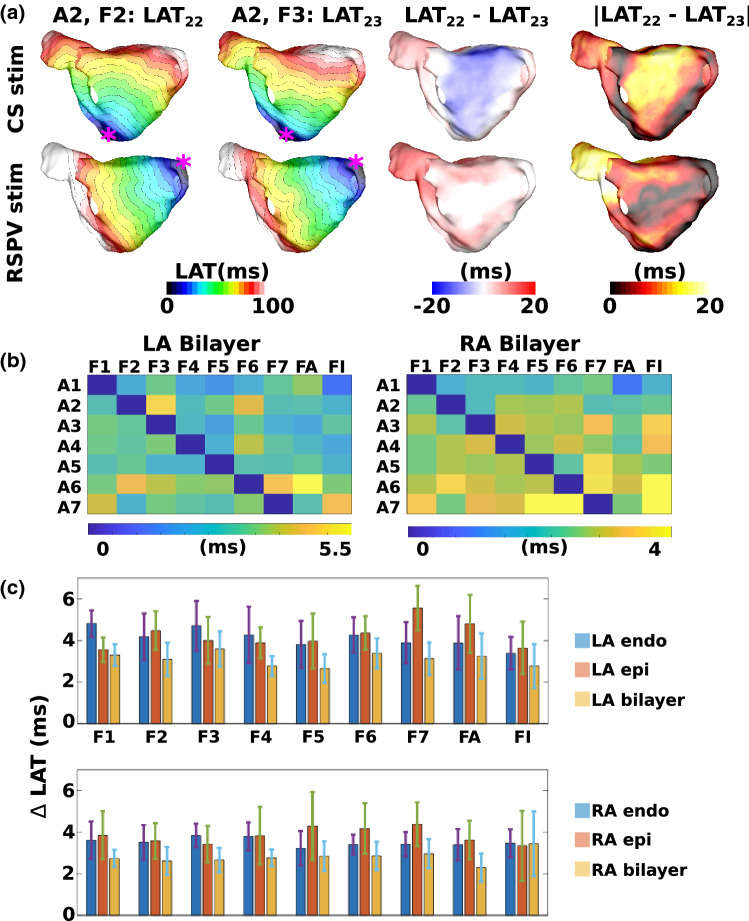
Figure 7.
Local activation time maps depend on fibre field. (a) Example LAT maps with pacing from the CS (top) and RSPV (bottom) for either the patient-specific fibre field (first column) or a fibre field mapped from a different anatomy (second column). Spatial maps of the differences (third column) and absolute differences between these LAT maps were constructed (fourth column), and the median of these two fields was calculated. Isochrone lines are at 5ms spacing. (b) Median absolute LAT differences are shown for each anatomy (rows A1–A7) between each fibre field (columns F1–F7, FA and FI) and the gold standard LAT map (corresponding to the fibre field for that anatomy), for LA bilayer (left) and RA bilayer (right) simulations. (c) Bar charts showing the mean and standard deviation of the median LAT differences for each fibre field (F1–F7, FA and FI), calculated across the 7 anatomies. These are given for the endocardial, epicardial and bilayer simulations for the LA (top) and RA (bottom). FA corresponds to the average fibre field; FI corresponds to the isotropic case.

