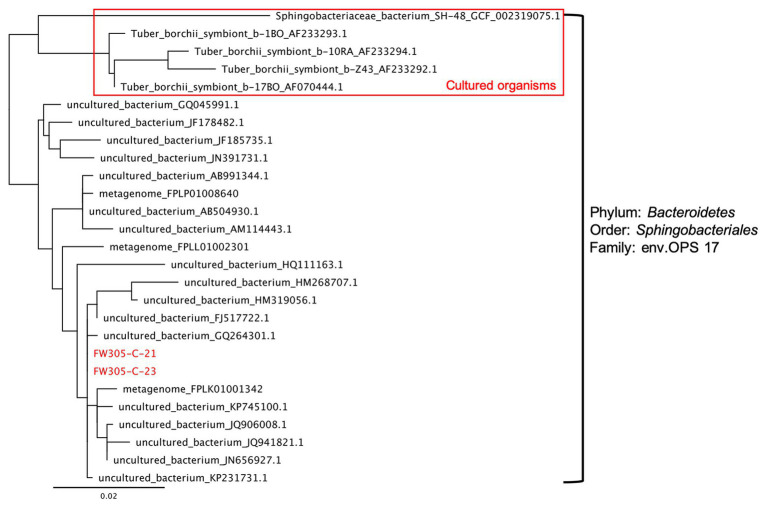
Figure 6.
Phylogenetic tree of the isolates FW305-C-21, FW305-C-23, and the most similar bacteria based on 16S rRNA genes. Scale bar indicates a change of 0.02 per nucleotide. The 16S rRNA gene sequences were aligned using SINA against the SILVA alignment, and the maximum likelihood tree was calculated using RAxML. The top five organisms are as far cultured organisms within this family.

