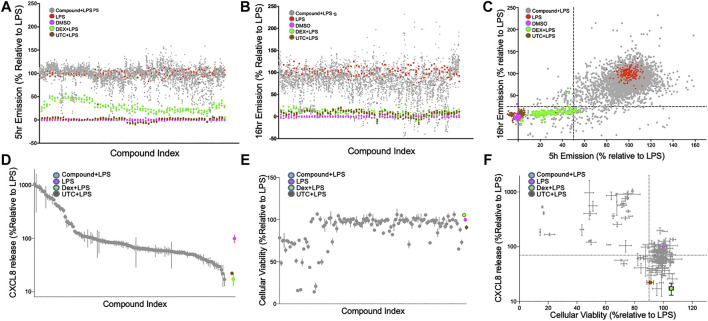
FIGURE 2.
Confirmation screen of compounds for NF-κB reporter activity, viability and chemokine stimulation; (A–C): Confirmation screening of initial 1824 hit compounds. Inhibition of an LPS induced signal by compound as a percent NF-ĸB activity relative to LPS controls at 5 h; (A), 16 h; (B) and both; (C). 1824 compounds were assessed with LPS as the primary stimulus using the FRET assay with THP-1 CellSensor NF-κB reporter cells. The percent NF-κB activation was calculated relative to DMSO + LPS (red) as 100% and DMSO as vehicle control (magenta) as 0%. All assay runs included DEX + LPS (green), and UTC + LPS (brown) as positive controls. Gray dots represent the duplicate data of each of the tested compounds. 122 compounds were selected based on the “Top-X″ criteria: < 25% at 16 h or <50% at 5 h (dotted lines) (D and E). Relative CXCL8 production and cellular viability of THP-1 cells treated with the 122 selected compounds. THP-1 cells treated with LPS (10 ng/ml) and 122 hit compounds (5 µM) were analyzed for CXCL8 production by ELISA; (D), and tested for cellular toxicity by MTT assay; (E). Results were normalized relative to the LPS controls, and ranked by CXCL8 production. The compounds in (D) and (E) are presented in the same order. (F) Both assays are plotted and the dotted line indicates 70% production of CXCL8 and 90% viability relative to the control. DEX (blue) and UTC (brown) were used as positive controls. Data shown as mean ± SD of triplicate data.

