FIGURE 3.
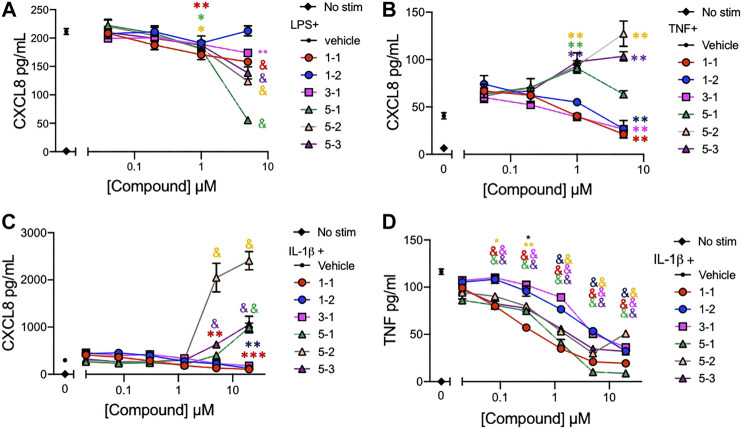
Cytokine and chemokine suppression by the lead compounds in THP-1 cells (A–C) CXCL8 production by THP-1 cells treated with graded concentrations of the indicated compounds and stimulated with 10 ng/ml of LPS; (A), 2 ng/ml of TNF; (B), or 2 ng/ml of IL-1ß; (C) overnight; (D) TNF production from THP-1 cells stimulated with 2 ng/ml of IL-1ß and compounds overnight. Candidate compounds were added at indicated concentrations with 0.1% final concentration of DMSO as vehicle. Shown are mean ± SEM and * indicates p < 0.05, **p < 0.01, ***p < 0.001, & p < 0.0001 by ANOVA with Dunnett’s post hoc test comparing compound against vehicle + LPS, TNF or IL-1ß respectively. Data are representative of two independent experiments showing similar results.

