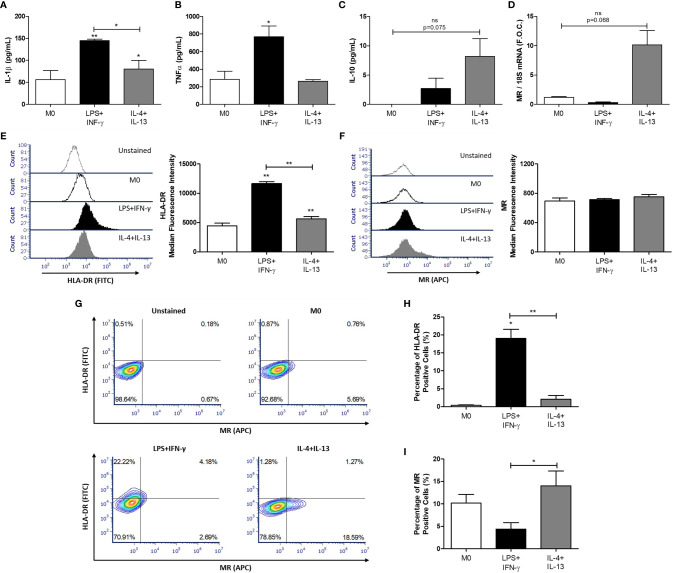
Figure 2.
Polarization of THP-1 macrophages. THP-1 monocytes were polarized into THP-1 macrophages (M0) using PMA (320 nmol/L) for 72 h, after which cells underwent a 24 h rest phase to allow the M0 phenotype to develop. Macrophages were then treated for 48 h with 100 ng/ml LPS and 20 ng/ml IFN-γ to polarize cells to M1 macrophages and 20 ng/ml IL-4 and IL-13 for M2 macrophages. The supernatants were analyzed by ELISA for (A) IL-1β, (B) TNF-α, and (C) IL-10 secretion. RNA was analyzed for (D) MR expression by qRT-PCR using 18S rRNA (18S) as the reference gene and graphed as fold over control (F.O.C.). Flow cytometry analysis was used to determine the median fluorescence intensity of (E) HLA-DR (FITC) and (F) MR (APC) and illustrated using a representative histogram plot. (G) Quadrant regions were used to detect the percentage of macrophages positive for HLA-DR (FITC) and MR (APC) following the respective treatments. The percentage of (H) HLA-DR and (I) MR positive cells was determined and graphed. Error bars are representative of independent experiments performed in duplicate for TNF-α (n = 3), IL-10 (n = 4), IL-1β (n = 7), MR (n = 3) and HLA-DR (n = 3). Statistical analysis was carried out performing multiple paired t-tests comparing all groups. *p < 0.05 and **p < 0.01, were considered statistically significant. * over the columns are comparisons with the control M0 group. Significance between other groups is indicated by capped lines. ns, not significant.

