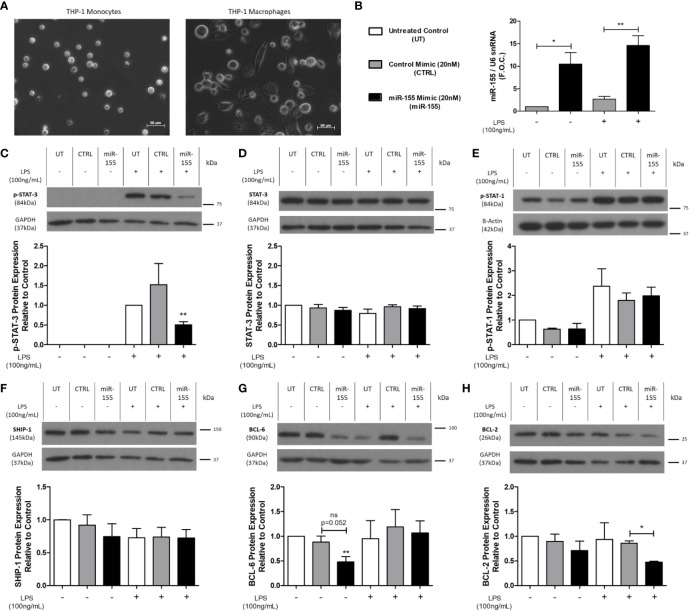
Figure 4.
p-STAT-3, BCL-6, and BCL-2 protein expression is decreased following miR-155 mimic transfection of THP-1 M0 macrophages. (A) Light microscopy images of THP-1 monocytes which were differentiated to macrophages using PMA (320 nmol/L) for 72 h followed by a 24-h rest phase. Macrophages were transfected for 24 h with 20nmol/L of miR-155 mimic using Lipofectamine™ 3000. Scrambled negative control mimic and Lipofectamine™ 3000 only (untreated) were used as controls. The media was removed, and cells were stimulated with LPS (100 ng/ml) for 18 h using dH2O as the control. Cells were harvested for RNA and protein. Transfection efficacy was analyzed for (B) miR-155 expression (n = 5) by qRT-PCR and graphed as fold over control (F.O.C.). Western blotting and densitometry analysis were performed on (C) p-STAT-3 (n = 4), (D) Total STAT-3 (n = 3), (E) p-STAT-1 (n = 3), (F) SHIP-1 (n = 5), (G) BCL-6 (n = 5), and (H) BCL-2 (n = 3) expression, using β-actin and GAPDH as the loading controls. Statistical analysis was performed using multiple paired t-tests where *p < 0.05 and **p < 0.01 represented statistical significance. * over the columns represent statistical significance when compared to the untreated control group. Significance between other groups is indicated by capped lines.

