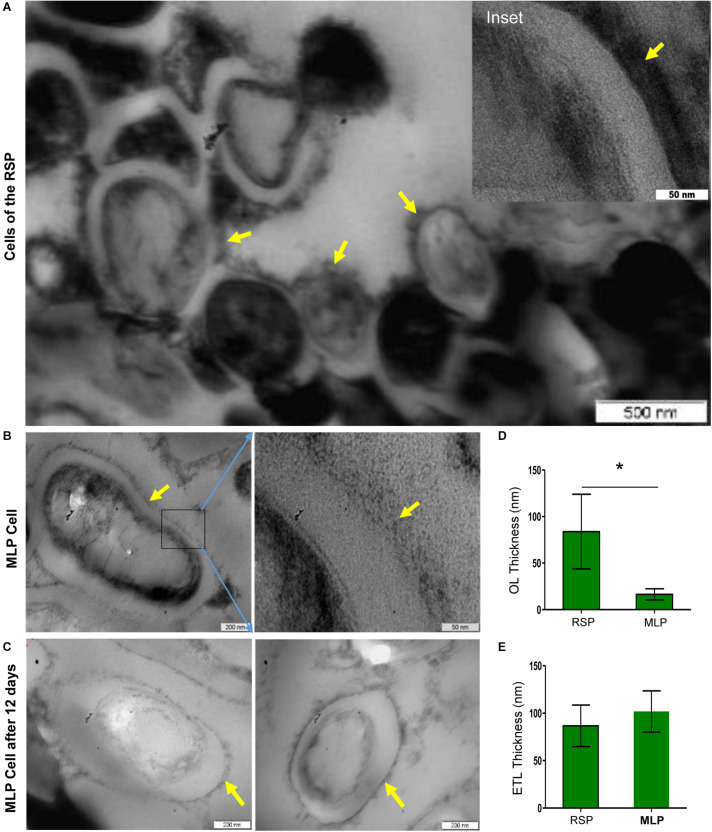
FIGURE 4.
Presence of TCOL in the M. tuberculosis cells from the rifampicin surviving population (RSP). (A,B) Transmission electron micrograph of the cells of the rifampicin surviving population (RSP; 12th day of exposure) and of the MLP population. (A) The cells of the RSP with thickened capsular outer layer (TCOL). (B) The MLP cell (control) with NCOL. Magnified images are shown as inset in (A) and on the respective adjacent panels in (B). The NCOL of the MLP cells cultured for 12 days without rifampicin is shown in (C). The yellow arrows indicate TCOL/NCOL of RSP/MLP, respectively. (D) Thickness (in nm) of the TCOL/NCOL of the cells of the RSP and MLP population. ∗ indicates p value <0.05. (E) Thickness (in nm) of electron transparent layer (ETL) of the cells of the RSP and MLP populations.

