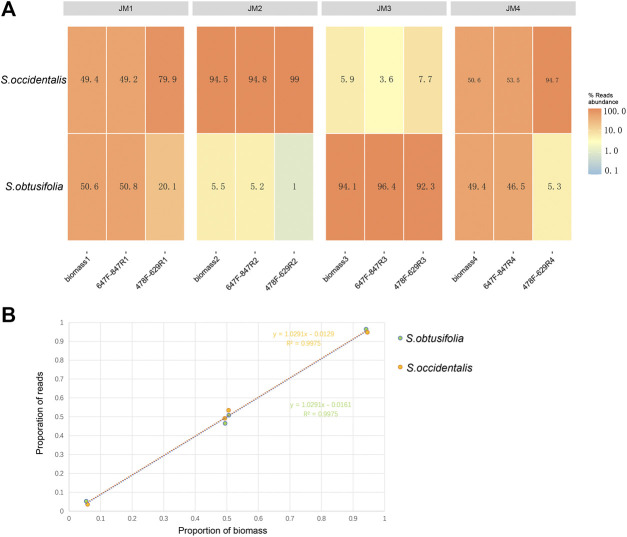
FIGURE 3.
Analysis of species reads abundance and species biomass abundance (A) Heat map of reads abundance of two primer pairs in four experimental mixtures (B) For primer 657F-858R, the correlation analysis of species reads proportion and species biomass proportion in four experimental mixtures. X-axis, proportion of biomass; Y-axis, proportion of reads.

