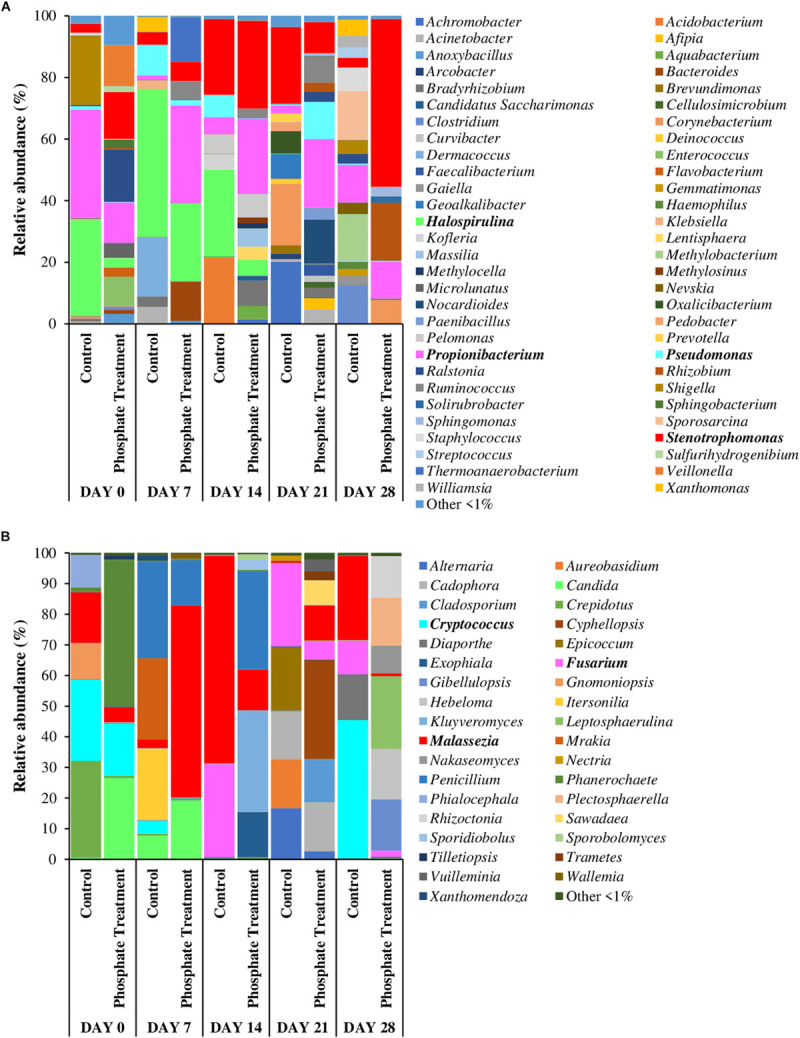
FIGURE 4.

Relative abundance of most abundant bacterial (A) and fungal (B) genera. Average of relative abundance of the most abundant fungal genera (n = 3) in different sampling time (0,7, 14, 21, and 28 days) of different treatments (phosphate treatment and control) belonging to biofilm coupons samples. The most abundant genera are those which have a relative abundance up to 1% in all the samples.
