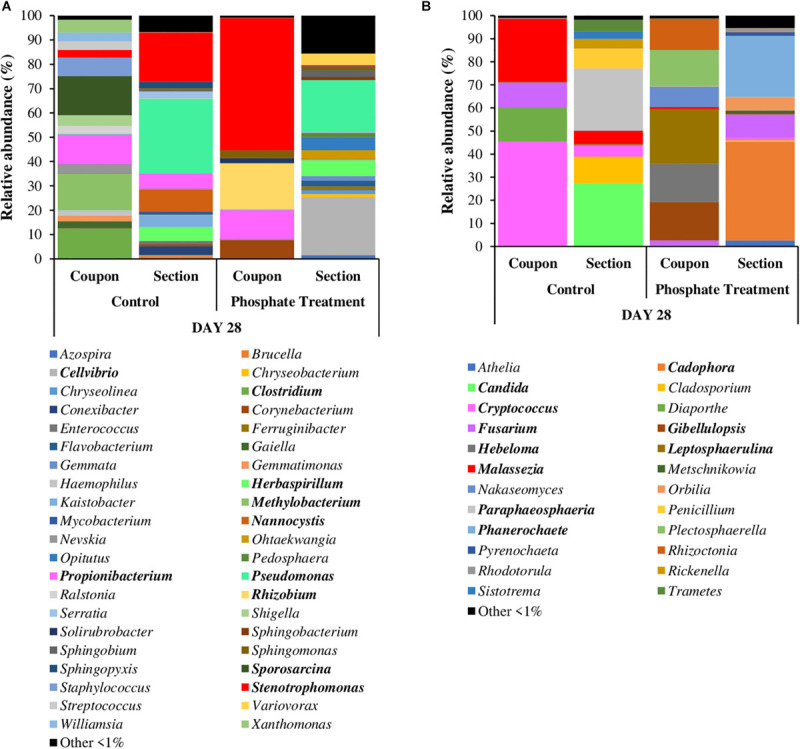
FIGURE 5.

Relative abundance of most abundant bacterial (A) and fungal (B) genera in coupons and sections. It is shown the average of relative abundance of the most abundant bacterial and fungal genera (n = 3) at 28 days of different treatments (phosphate treatment and control) and in coupons and section samples. The most abundant genera are those which have a relative abundance up to 1% in all the samples.
