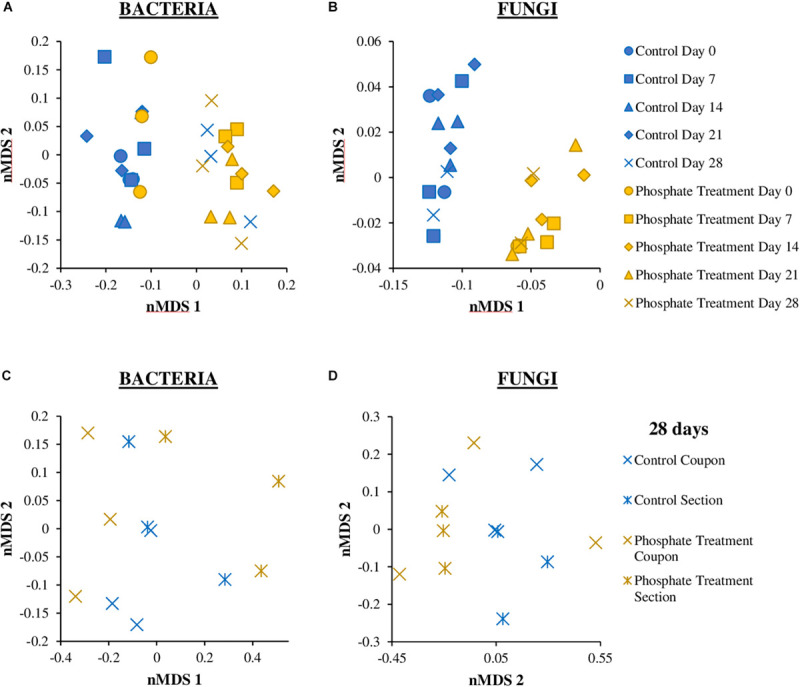
FIGURE 6.

Non-metric multidimensional scaling (nMDS) plot based on the bacterial (A,C) and fungal (B,D) relative abundance of biofilm coupons (A,B) and section (C,D) samples. The analysis was based on Bray–Curtis similarity matrix calculated from the relative abundance of bacteria and fungi OTUs at 97% cut off. The different groups are clustering according to the treatment used (Phosphate treatment and Control) and the time sampling (0, 7, 14, 21, 28 days).
