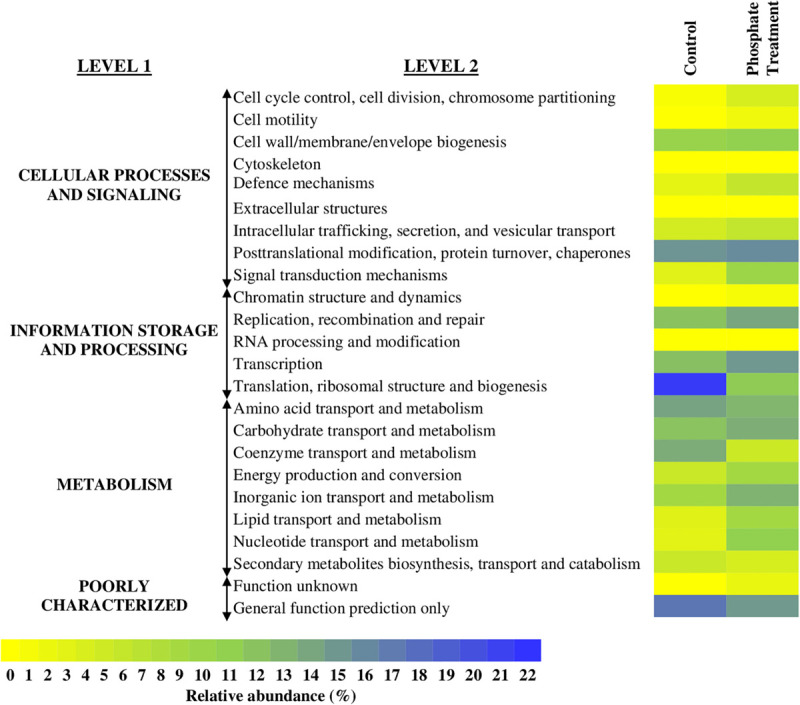
FIGURE 7.

Heatmap with the relative abundance of annotated genes in the whole metagenome of each of the sequenced samples. It is shown MG-RAST analyses of biofilm samples based in COGs database. The average of relative abundance (n = 3) of the level 1 and 2 functional categories is expressed in a rage of colour from yellow (0%) to blue (22%).
