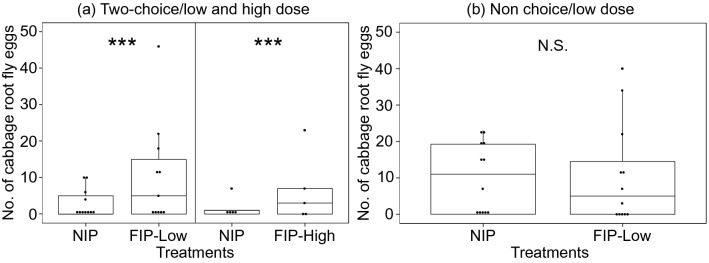
Figure 6.
Symmetrical dot-density plot with superimposed box plot showing the distribution of the total number of eggs laid by cabbage root fly females: (a) two-choice experiments on non-inoculated control plants (NIP) and root-associated entomopathogenic fungal (R-AEF)-inoculated plants at low (FIP-Low) and high concentration of fungal inoculum (FIP-High) and (b) no-choice experiments on NIP and FIP-Low. Dots represent individual sampled host plants. Boxplots visualize five summary statistics (the middle bar = median; box = inter-quartile range; bars extend to 1.5× the inter-quartile range the median). Stars represent *p < 0.05, **p < 0.01, ***p < 0.001, N.S. not significant.

