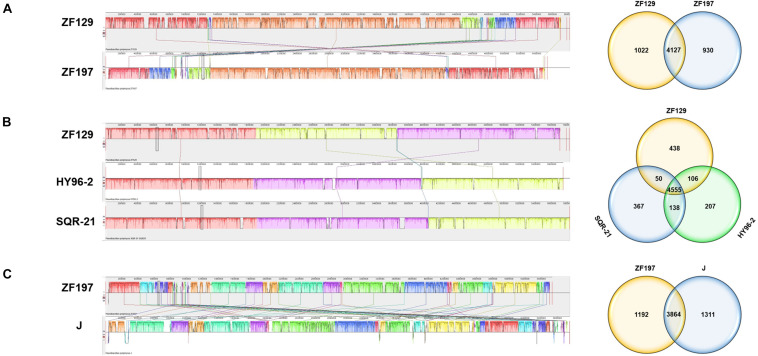
FIGURE 3.
Global alignment of the genome sequences of two completely sequenced P. polymyxa strains against three other P. polymyxa genome sequences. (A) Mauve progressive alignment of the ZF129 and ZF197 genomes. (B) Mauve progressive alignment of the ZF129, HY96-2, and SQR-21 genomes. (C) Mauve progressive alignment of the ZF197 and J genomes. The ZF129 genome and the ZF197 genome were used as the reference genomes. Boxes with the same color indicate syntenic regions. Boxes below the horizontal strain line indicate inverted regions. Rearrangements are indicated with colored lines. The scale is in nucleotides. The Venn diagram shows the numbers of shared and unique Clusters of Orthologous Genes at the subspecies and species levels.

