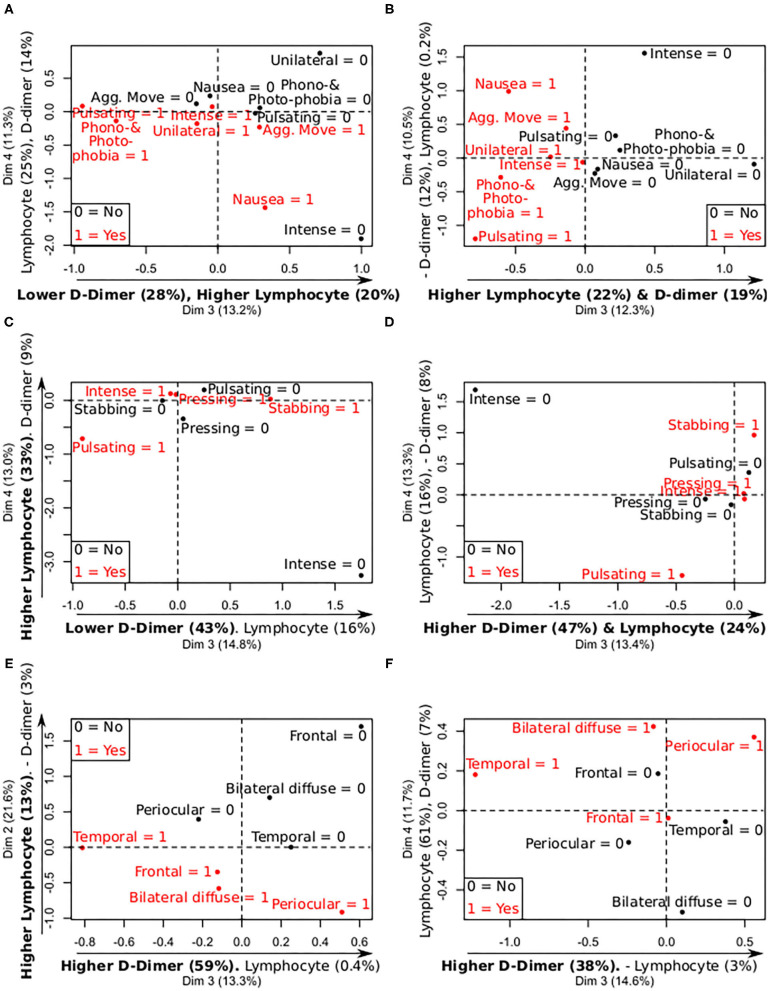
Figure 3.
Summary of mix PCA of CRP, PCT, D-dimer, and lymphocytes levels (continuous variables), and the analyzed categorical features, focused on D-dimer and lymphocyte levels. X- and Y-axis contain the values of two principal components, and the relative contribution of each continuous variable to the component, remarking in bold the most important relationships between the continuous variables and the components. 0 = no symptom; 1 = present symptom. (A) Levels—Migraine symptoms D-dimer and lymphocytes (admission). (B) Levels—Migraine symptoms D-dimer and lymphocytes (worst values). (C) Levels—Quality of pain D-dimer and lymphocytes (admission). (D) Levels—Quality of pain D-dimer and lymphocytes (worst values). (E) Levels—Laterality and topography D-dimer and lymphocytes (admission). (F) Levels—Laterality and topography D-dimer and lymphocytes (worst values).

