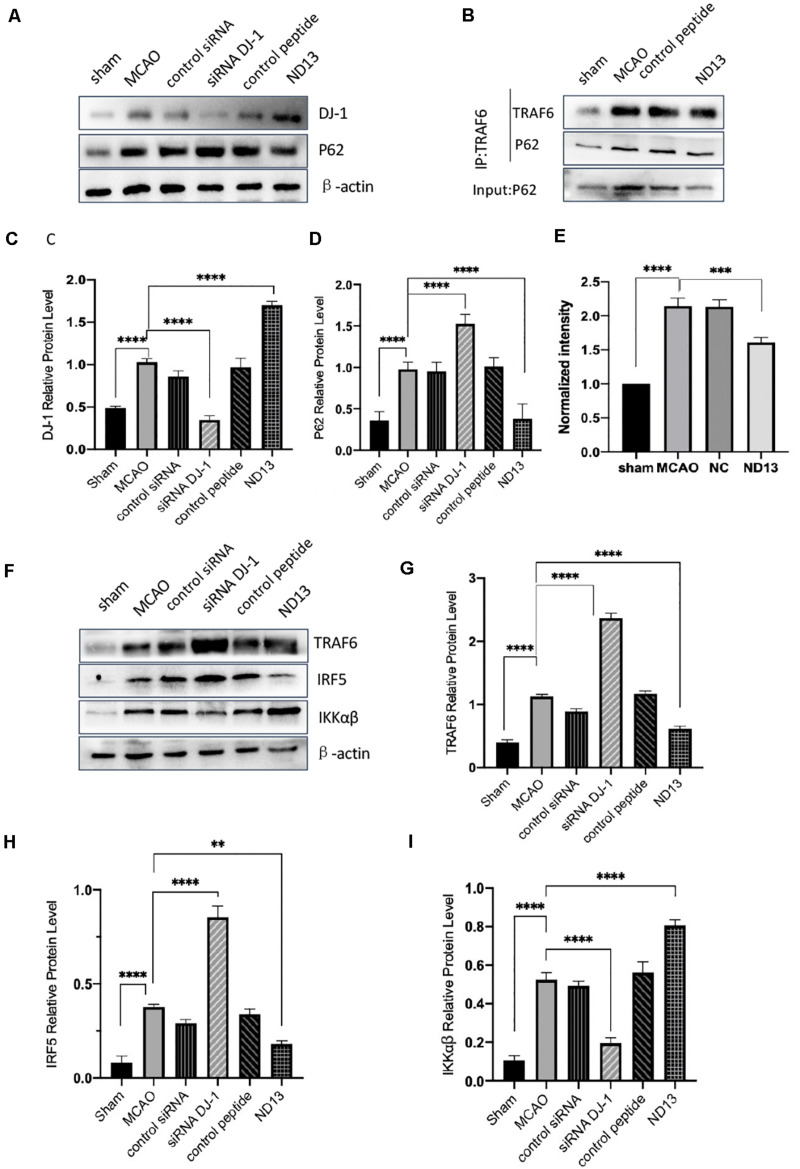
FIGURE 3.
The correlation between DJ-1 and the P62-TRAF6/IRF5 pathway after cerebral I/R. (A,C,D) Western blot analysis of DJ-1 and P62 expression in rats. (B) DJ-1 affects the interaction between P62 and TRAF6 after cerebral I/R in rats. (E) Quantification of (B) P62 Co–IP intensity normalized to TRAF6 IP (compared to sham). (F–I) Western blot analysis of TRAF6, IRF5, and IKKαβ expression in rats. *p < 0.05, **p < 0.01, ***p < 0.001, ****p < 0.0001; n = 6 per group.

