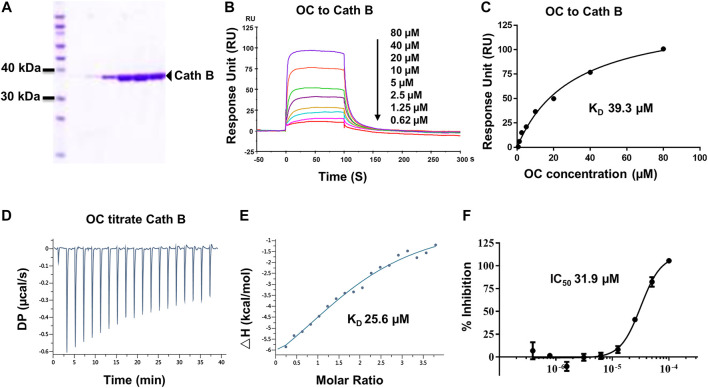
FIGURE 3.
Verifying the potential binding of Cath B with OC. A Coomassie blue staining of Cath B. (A) total of 10 µg of Cath B purified from different conditions were loaded for SDS-PAGE followed by Coomassie blue staining. (B) Biacore SPR analysis of Cath B and OC. Cath B was immobilized on a CM5 chip, and different concentrations of OC passed through the chip in 60 s. The curves indicate the potential binding between OC and Cath B. (C) the KD value for Cath B and OC binding was calculated from Biacore SPR data. (D) and E ITC measurement of Cath B and OC was conducted at 25°C. (D) The raw ITC data for injecting OC into Cath B protein. (E) The binding curve was integrated by a one-site binding model. (F) Inhibitory effect of OC on Cath B protease activity. Cath B was incubated with different concentrations of OC, and the inhibition curve was obtained and calculated using fluorescence intensity.

