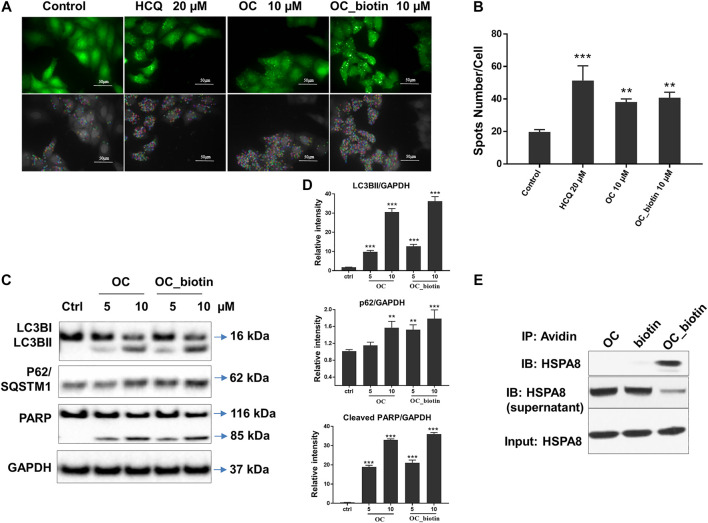
FIGURE 5.
Verifying the potential binding between OC_biotin and HSPA8 in cells. (A) OC_biotin or OC induced GFP-LC3 puncta in HeLa cells. HeLa cells with stable expression of GFP-LC3 were treated with 10 µM OC or 10 µM OC_biotin for 6 h, and GFP fluorescence was detected and analyzed using a high content screening system. Scale bar, 50 µm. (B) Statistical analysis of the number of GFP puncta formed per cell. Data are expressed as mean ± standard deviation of three independent experiments compared with control (**p < 0.01, ***p < 0.001 vs. control). (C) Western blot of LC3B, p62, and PARP. HeLa cells were treated with 10 µM OC or 10 µM OC_biotin for 24 h. The cells were lyzed using RIPA buffer and the protein expression level was analyzed by western blot. (D) Statistical analysis on the relative intensity of LC3BII, P62, cleaved PARP vs. GAPDH. GAPDH protein was used as loading control. Data are expressed as mean ± standard deviation of three independent experiments (*p < 0.05, **p < 0.01, ***p < 0.001 vs. control). (E) Immunoprecipitation of HSPA8 and OC_biotin. OC_biotin was incubated with avidin beads followed by immunoprecipitation and western blot. Upper lane: pulldown proteins eluted from avidin beads; middle band: proteins from supernatant after immunoprecipitation; lower band: input HSPA8 protein as control.

