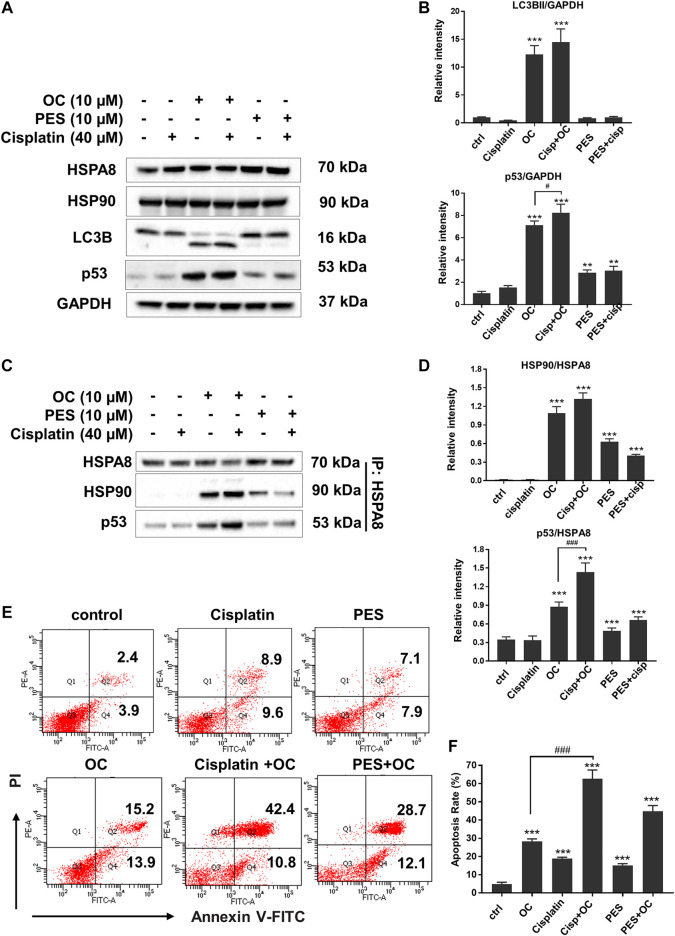
FIGURE 7.
OC promotes apoptosis upon cisplatin treatment. (A) OC increased p53 expression level when co-treated with cisplatin. A549 cells were treated with the combination of 10 µM OC, 40 µM cisplatin, and 10 µM PES for 24 h. Western blot analysis showed the changes in p53 and LC3B cleavage. (B) Statistical analysis on the relative intensity of LC3BII and P53 vs. GAPDH. GAPDH protein was used as loading control. Data are expressed as mean ± standard deviation of three independent experiments (*p < 0.05, **p < 0.01, ***p < 0.001 vs. control; # p < 0.05 vs. OC group). (C) OC enhanced the binding between HSPA8, HSP90, and p53. A549 cells were treated with the combination of 10 µM OC, 40 µM cisplatin, or 10 µM PES for 24 h. Cell lysates were immunoprecipitated with HSPA8, and western blot analysis was performed for HSPA8, HSP90, and p53. (D) Statistical analysis on the relative intensity of HSP90 and P53 vs. HSPA8. HSPA8 protein was used as loading control. Data are expressed as mean ± standard deviation of three independent experiments (*p < 0.05, **p < 0.01, ***p < 0.001 vs. control; ### p < 0.001 vs. OC group). (E,F) OC potentiated cell death upon cisplatin treatment. A549 cells were treated with the combination of 10 µM OC, 40 µM cisplatin, or 10 µM PES for 24 h. The cells were collected and stained with Annexin V and PI for subsequent flow cytometry analysis. F shows the results of statistical analysis of apoptotic cells. Data are expressed as mean ± standard deviation of three independent experiments (*p < 0.05, **p < 0.01, ***p < 0.001 vs. control; ### p < 0.001 vs. OC group).

