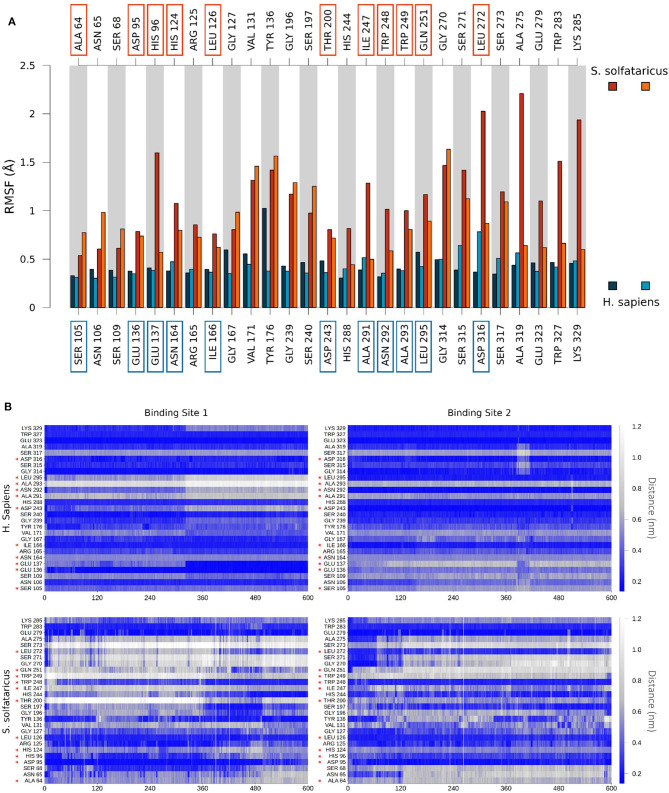
Figure 5.
(A) Comparison of per-residue root mean square fluctuation of binding site residues in H. sapiens and S. solfataricus. Values are drawn as barplots in different colors for the two binding sites in H. sapiens (shades of blue, labeled at bottom) and S. solfataricus (shades of red, labeled on top). Residues not conserved in the two species are highlighted with squares. (B) Protein–ligand contacts during the unbiased MD simulation. The minimum distance between atoms of the ligand and atoms of each residue of the binding site was monitored for H. sapiens (top) and S. solfataricus (bottom). The values are drawn in a colorscale with blue indicating lower distances and white higher distances. Residues not conserved in the two species are highlighted with a red star.

