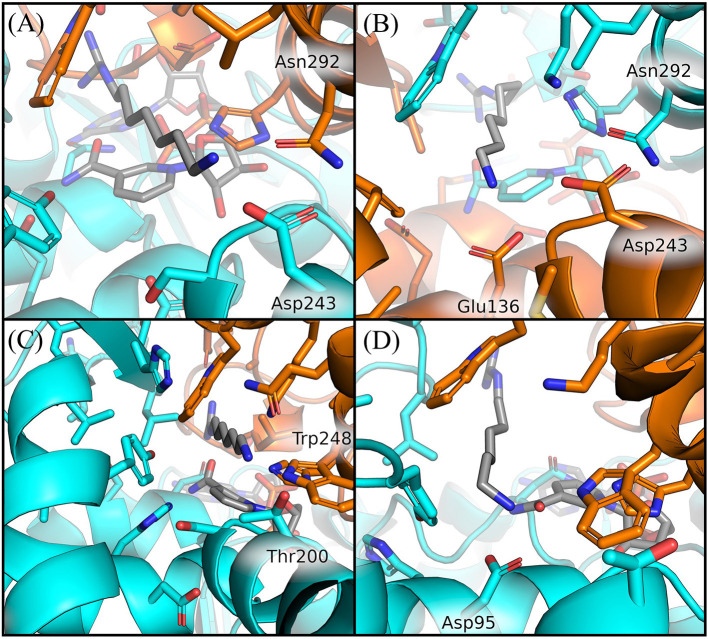
Figure 6.
Comparison of GC7 interactions with residues of H. sapiens and S. solfataricus. Residues of H. sapiens within 5 Å from ligand are shown in sticks for binding site 2 at 200 ns (A) and for binding site 1 at 350 ns (B). Residues of S. solfataricus within 5 Å from ligand are shown in sticks for binding site 1 at the beginning of the simulation (C) after 200 ns (D). Protein sticks and cartoon are colored in cyan for the first chain and orange for the second chain.

