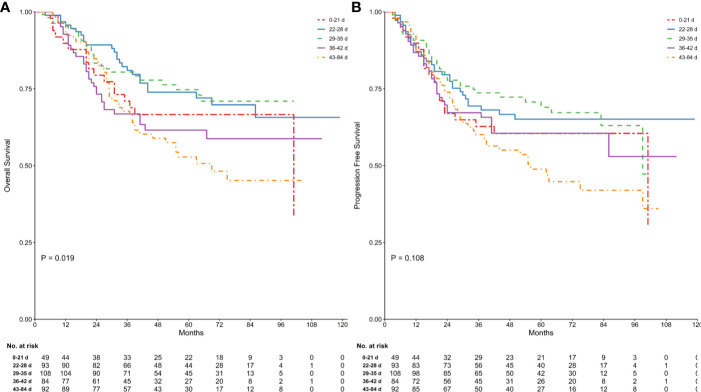
Figure 1.
Comparison of survival in groups stratified by time between the end of neoadjuvant therapy and gastrectomy. Kaplan Meier analysis for OS (log-rank test of equality, P = 0.019; (A) and PFS (log-rank test of equality, P = 0.108; (B) were shown. Numbers below the graph indicate the number of subjects at each follow-up.

