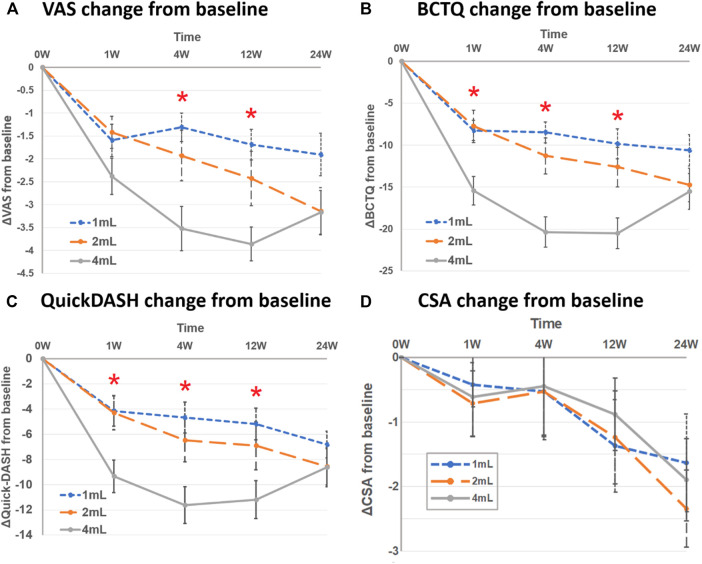
FIGURE 2.
Mean change from baseline between three groups at follow-up time points (1st, 4th, 12th and 24th week) in (A) visual analog scale (VAS), (B) Boston Carpal Tunnel Syndrome Questionnaire (BCTQ) scores, (C) QuickDASH, and (D) cross-sectional area of median nerve (CSA). Asterisk represented significant difference between three groups.

