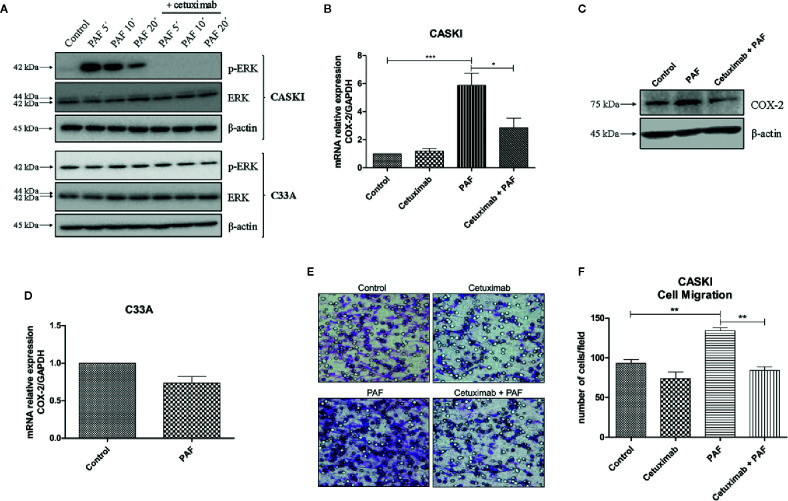
Figure 5.
Platelet-activating factor (PAF) transactivates epidermal growth factor receptor (EGFR), modulating MAPK activation, COX-2 upregulation, and cell migration. (A) CASKI and C33A cells were starved for 16 h and treated with cetuximab (100 µg/ml). One and a half-hour later, cells were stimulated with PAF (100 nM) for 5–20 min. Afterward, cells were lysed and levels of p-ERK, total ERK and beta-actin (loading control) were determined by Western blotting. Representative image of two experiments. (B) After starving, CASKI cells were treated with cetuximab (100 µg/ml) for 1.5 h, and subsequently treated with PAF (100 nM) also for 1.5 h. Then, mRNA was extracted and converted into cDNA. Gene expression assays for COX-2 and GAPDH (reference gene) were performed by qPCR. Values represent mean + SD of five independent experiments. (C) CASKI cell line was starved and treated with cetuximab (100 µg/ml) for 1.5 h, and subsequently stimulated with PAF (100 nM) for 3 h, when cells were lysed and the levels of COX-2 and β-actin (loading control) were determined by Western blotting. Representative image of two experiments. (D) C33A cells were starved and stimulated with PAF (100 nM) for 1.5h. Gene expression assays for COX-2 and GAPDH were also performed. Values represent mean + SD of five independent experiments. (E, F) For the cell migration assay, after starving, CASKI cells were treated with cetuximab (100 µg/ml) for 1.5 h followed by 16 h stimulation with PAF (100 nM). Then, cells were added to a Boyden chamber, using 8 μm pore polycarbonate membranes, and left to migrate toward RPMI containing 5% SFB for 20 h. (E) Representative images of the migration assay are shown on the panel (100× magnification). (F) Values represent mean of the number of cells migrated counted per field + SD of three independent experiments. For multiple comparisons, one-way ANOVA and Tukey’s post-test were used; while for comparisons of only two conditions, Student´s t-test was performed. *P < 0.05, **P < 0.01, ***P < 0.001.

