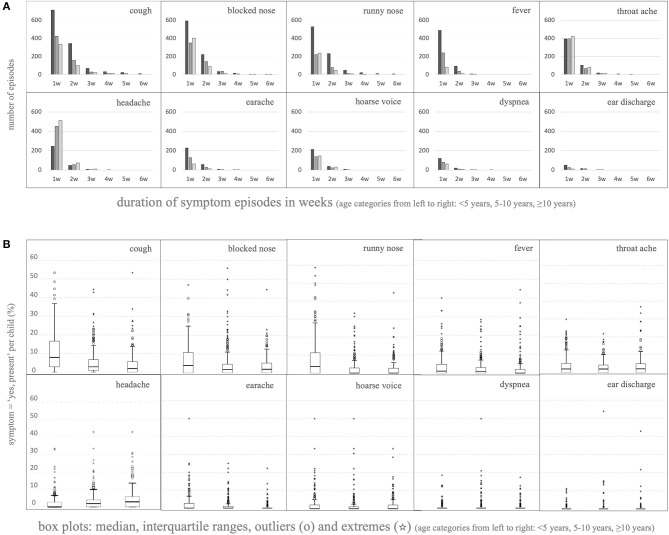
Figure 3.
Longitudinal analysis of the various parent-reported (combinations of) symptoms per individual child. (A) Duration of episodes of consecutive childweeks counted per individual child depicted up to six consecutive weeks; depicted per symptom, either occurring singly or together with other symptom(s) (for all data see Supplementary Table 3). For this analysis, episodes preceded and/or followed by a missing value (week not reported, or before the start or after the end of the study) were included in the count as if the missing value was “no symptoms in that week.” Thus, it could be that, in reality, the curves of episode duration are shifted slightly toward longer episodes. (B) Boxplots showing the distribution of the percentage of “yes, symptom present” per total reported childweeks counted per individual child per symptom [box = p25→p75, whiskers at 1.5*(p75–p25), outliers and extremes outside the whiskers at >1.5 ∨ <3*(p75–p25) (◦); or >3*(p75–p25) (*), respectively].

