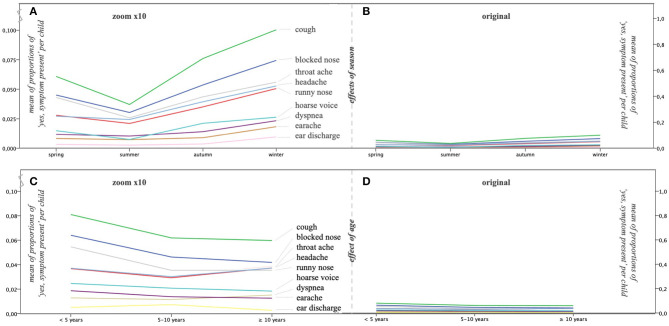
Figure 4.
Choosing the right perspective to evaluate the effects of season and age. The mean proportion of childweeks with “yes, symptom present” calculated per individual child per all reported child weeks is shown on the y-axis [(A,C): y-axis on the left; (B,D): y-axis on the right]. Zooming in on the symptoms (A,C) shows the effects; zooming out to the original size (B,D) shows the effects in the right perspective: they are limited. (A) The effects of season (x-axis) are clearly visible when zoomed in (× 10), albeit more pronounced for some symptoms than for others. (B) When zoomed out to the original size, it is clear that the effects of season are small. (C) When zoomed in (× 10), it is clear that an effect of age (x-axis) is present but only for a few symptoms (see also Table 1). (D) When zoomed out to the original size, it is clear that the effect of age is very limited.

