FIG 4.
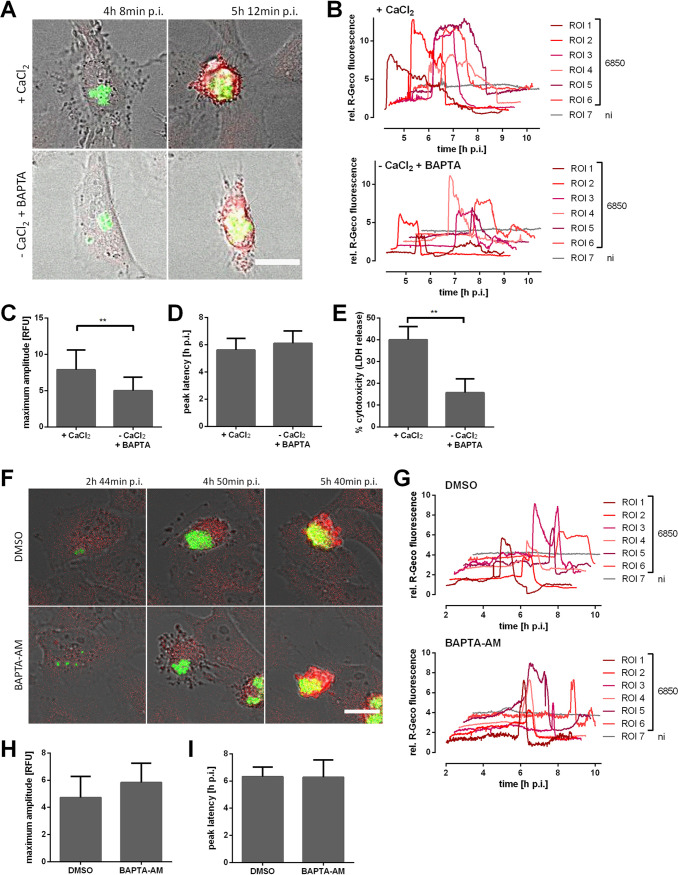
Removal of extracellular Ca2+ during S. aureus intracellular infection impairs cytosolic Ca2+ increase. (A to D) HeLa R-Geco cells were infected with S. aureus 6850 GFP, and at 3 h p.i., medium with 1.8 mM CaCl2 (+CaCl2) or without CaCl2 and with 0.2 mM BAPTA [1,2-bis(2-aminophenoxy)ethane-N,N,N′,N′-tetraacetic acid] (−CaCl2 +BAPTA) was added. Subsequently, R-Geco fluorescence was monitored by live cell imaging. (A) Representative stills of infected HeLa R-Geco cells with or without extracellular Ca2+ (green, S. aureus; red, R-Geco; gray, brightfield). Bar, 20 μm. (B) Relative R-Geco fluorescence of single infected (6850) or uninfected (ni) cells was quantified over the time course of infection under the different conditions. (C) The maximal amplitude of the relative R-Geco fluorescence of 6 to 11 single infected cells under the different conditions was determined. (D) The latency of the maximal relative R-Geco fluorescence peak after S. aureus intracellular infection was determined in 6 to 11 single infected cells. (E) HeLa cells were infected with S. aureus 6850, and at 3 h p.i., medium with 1.8 mM CaCl2 (+CaCl2) or without CaCl2 and with 0.2 mM BAPTA (−CaCl2 +BAPTA) was added. LDH release was quantified at 6 h p.i. (F to I) HeLa cells were infected with S. aureus 6850 GFP; at 2 h p.i., dimethyl sulfoxide (DMSO) or 5 μM BAPTA-AM [1,2-bis(2-aminophenoxy)ethane-N,N,N′,N′-tetraacetic acid tetrakis(acetoxymethyl ester)] were added, and R-Geco fluorescence was monitored over time. (F) Stills of representative infected cells are depicted (green: S. aureus; red, R-Geco; gray, brightfield). Bar, 20 μm. (G) Relative R-Geco fluorescence of single infected (6850) or uninfected (ni) cells was quantified over the time course of infection under the different conditions. (H) The maximum amplitude of the relative R-Geco fluorescence of 6 to 11 single infected cells under the different conditions was determined. (I) The latency of the relative R-Geco fluorescence peak after S. aureus intracellular infection in 6 to 11 single infected cells was calculated. Statistical analysis was performed by unpaired t test (**, P < 0.01; ***, P < 0.001).

