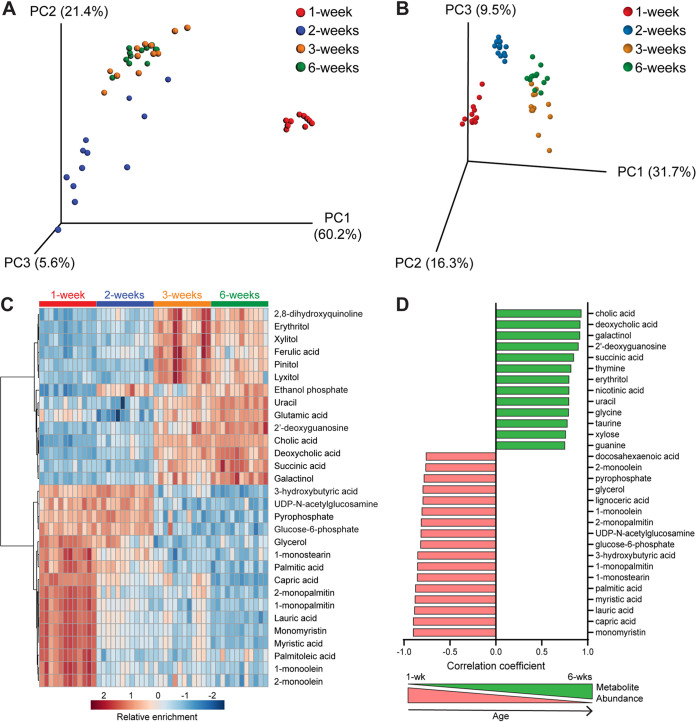
FIG 2.
Differences in small intestinal metabolites during murine postnatal development. PCoA plot of weighted Unifrac distances between cecal microbiota samples (A) and PCA plot of small intestinal metabolite differences from the same mice sampled at 1, 2, 3, or 6 weeks of age (B). (C) Hierarchical clustering of the top 30 metabolites that most significantly differed between groups as analyzed by one-way ANOVA, represented as a heat map with red indicating relative enrichment and blue indicating relative de-enrichment for the listed metabolites. (D) Bar graph showing the top 30 metabolites with relative abundances most significantly correlated with age by Pearson’s correlation. Red, negative correlation of metabolite abundance with age; green, positive correlation of metabolite abundance with age.

