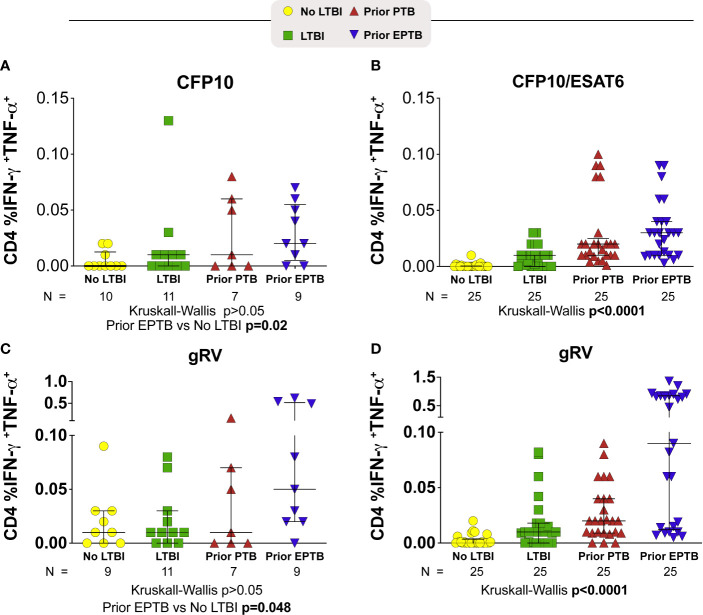
Figure 1.
CD4+ T-cell intracellular cytokine responses to M. tuberculosis antigens. Scatter plots depicting the expression of intracellular cytokine by CD4+ T-lymphocytes from TB patients with PTB or EPTP presentation and controls (TST+ and TST-). Frequencies of IFN-γ+TNF-α+CD4+ T cells from whole blood obtained and compared according to the stimulation. (A, B) Frequencies of IFN-γ+TNF-α+CD4+ T cells responses to stimulation with a pool of CFP-10 peptides (A; U.S. study population) or CFP-10 and ESAT-6 (B; Brazilian study population). (C, D) Frequencies of IFN-γ+TNF-α+CD4+ T cells responses after incubation of PBMC with gRV (C; U.S. study population) (D; Brazilian study population). Background has been subtracted out. Lines represent median values and interquartile ranges (IQR). The differences in median values (and IQR) between groups were compared using the Kruskal-Wallis test with Dunn’s multiple comparisons post-test. TB, tuberculosis; PTB, pulmonary tuberculosis; EPTB, extrapulmonary tuberculosis; TST, tuberculin skin test.

