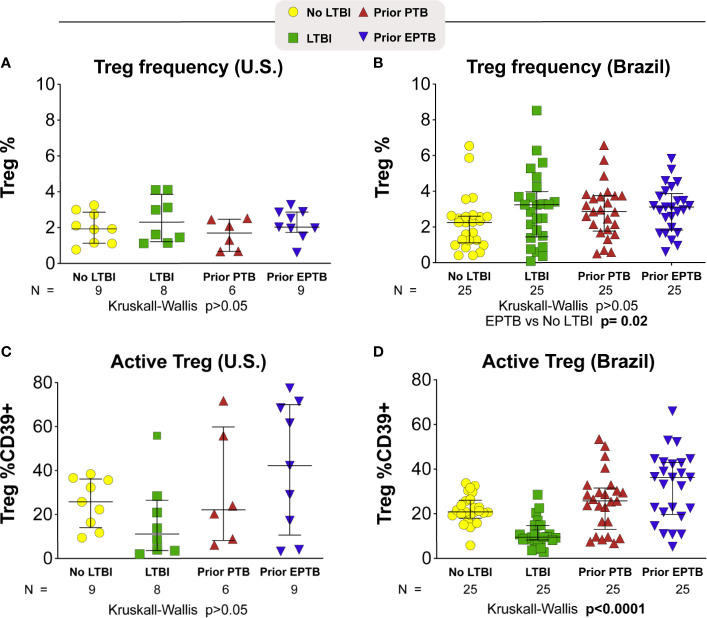
Figure 3.
T-regulatory cell frequency and phenotype. Scatter plots depicting the Treg frequency (A) in U.S. study population (B) in Brazilian study population. Frequency of Treg CD39+ (C) in U.S. study population (D) in Brazilian study population. Lines represent median values and interquartile ranges (IQR). The differences in median values (and IQR) between groups were compared using the Kruskal-Wallis test with Dunn’s multiple comparisons post-test. TB, tuberculosis; PTB, pulmonary tuberculosis; EPTB, extrapulmonary tuberculosis; TST, tuberculin skin test; CFP, Culture filtrate protein; ESAT, early secretory antigen of tuberculosis; gRV, γ-irradiated M. tuberculosis.

