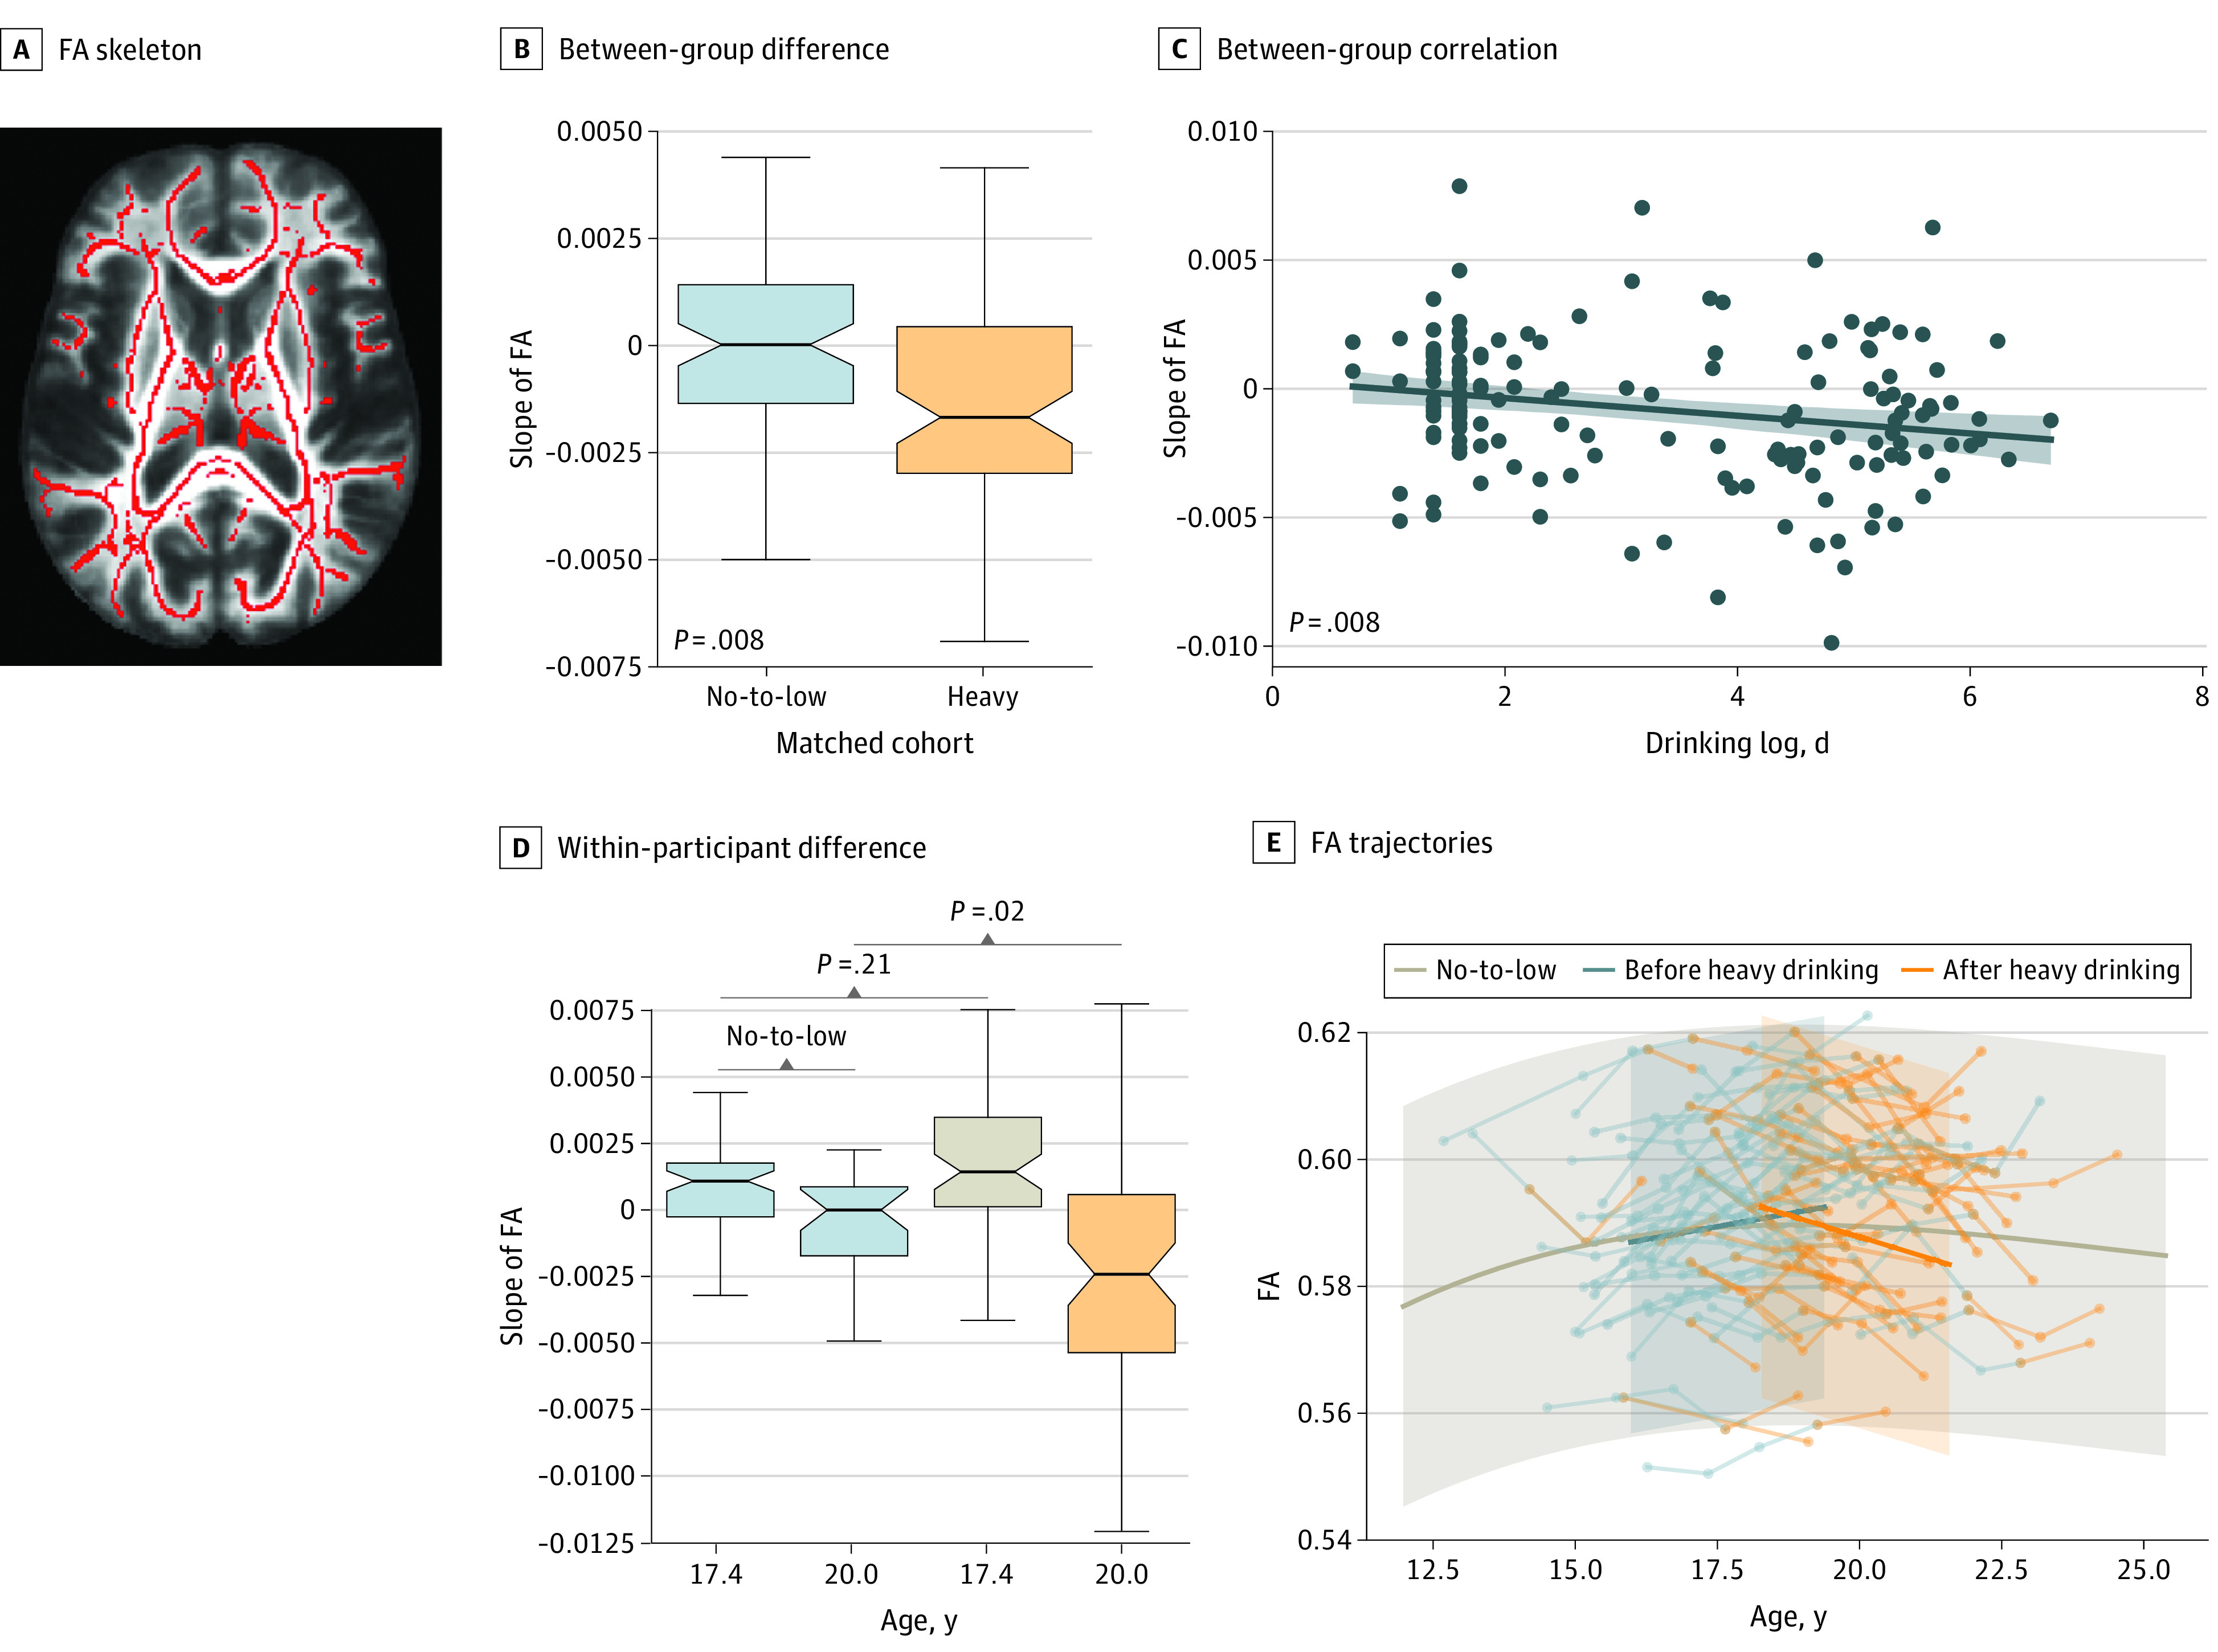
Figure 2. Between-Group and Within-Participant Analysis on the Whole-Brain FA.

A, Functional anisotropy (FA) skeleton. Whole-brain FA tract-based spatial statistics (TBSS) skeleton of the SRI24 atlas (a magnetic resonance imaging (MRI)–based atlas of normal adult human brain anatomy). B, Between-group difference. Significant group difference in the slope of whole-brain FA between the 78 no-to-low and 78 heavy drinkers. C, Between-group association. Significant association between slope and log of days of drinking since baseline visit in the matched cohorts. D, Within-participant difference. The slopes of the 63 transitioners (defined as no-to-low drinking for at least 2 visits before initiating heavy drinking) were significantly different from age-matched no-to-low drinkers after drinking onset but not before. E, FA trajectories. FA trajectories of the 63 transitioners before and after drinking onset overlaid with the trajectory of the 291 no-to-low drinkers. Boxplots in panels B and D represent the minimum, first quartile, median, third quartile, and maximum FA slope. Shading in C represents the 95% CI for the regression estimate. Shading in E represents +3/-3 SD of FA for the 291 no-to-low drinkers.
