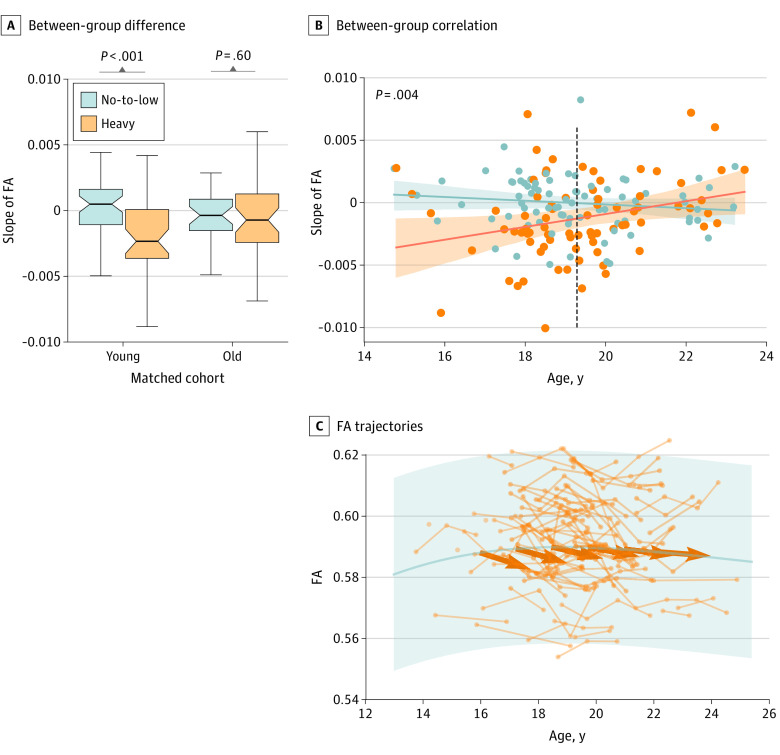
Figure 3. Alcohol Associations in Younger vs Older Adolescents.
A, Between-group difference. Group difference in slope was only significant in the younger cohort (age <19.3 years) but not in the older cohort. Boxplots represent the minimum, first quartile, median, third quartile, and maximum FA slope. B, Between-group association. Significant age-drinking-group interaction on the slope in the 2 matched cohorts. Shading represents the 95% CI for the regression estimates. C, Functional anisotropy (FA) trajectories. The trajectories of the 78 heavy drinkers overlaid with the trajectory of the 291 no-to-low drinkers. Shading represents the +3/–3 SD of FA for the 291 no-to-low drinkers; bold arrows represent mean FA reduction of heavy drinkers at each age range.

