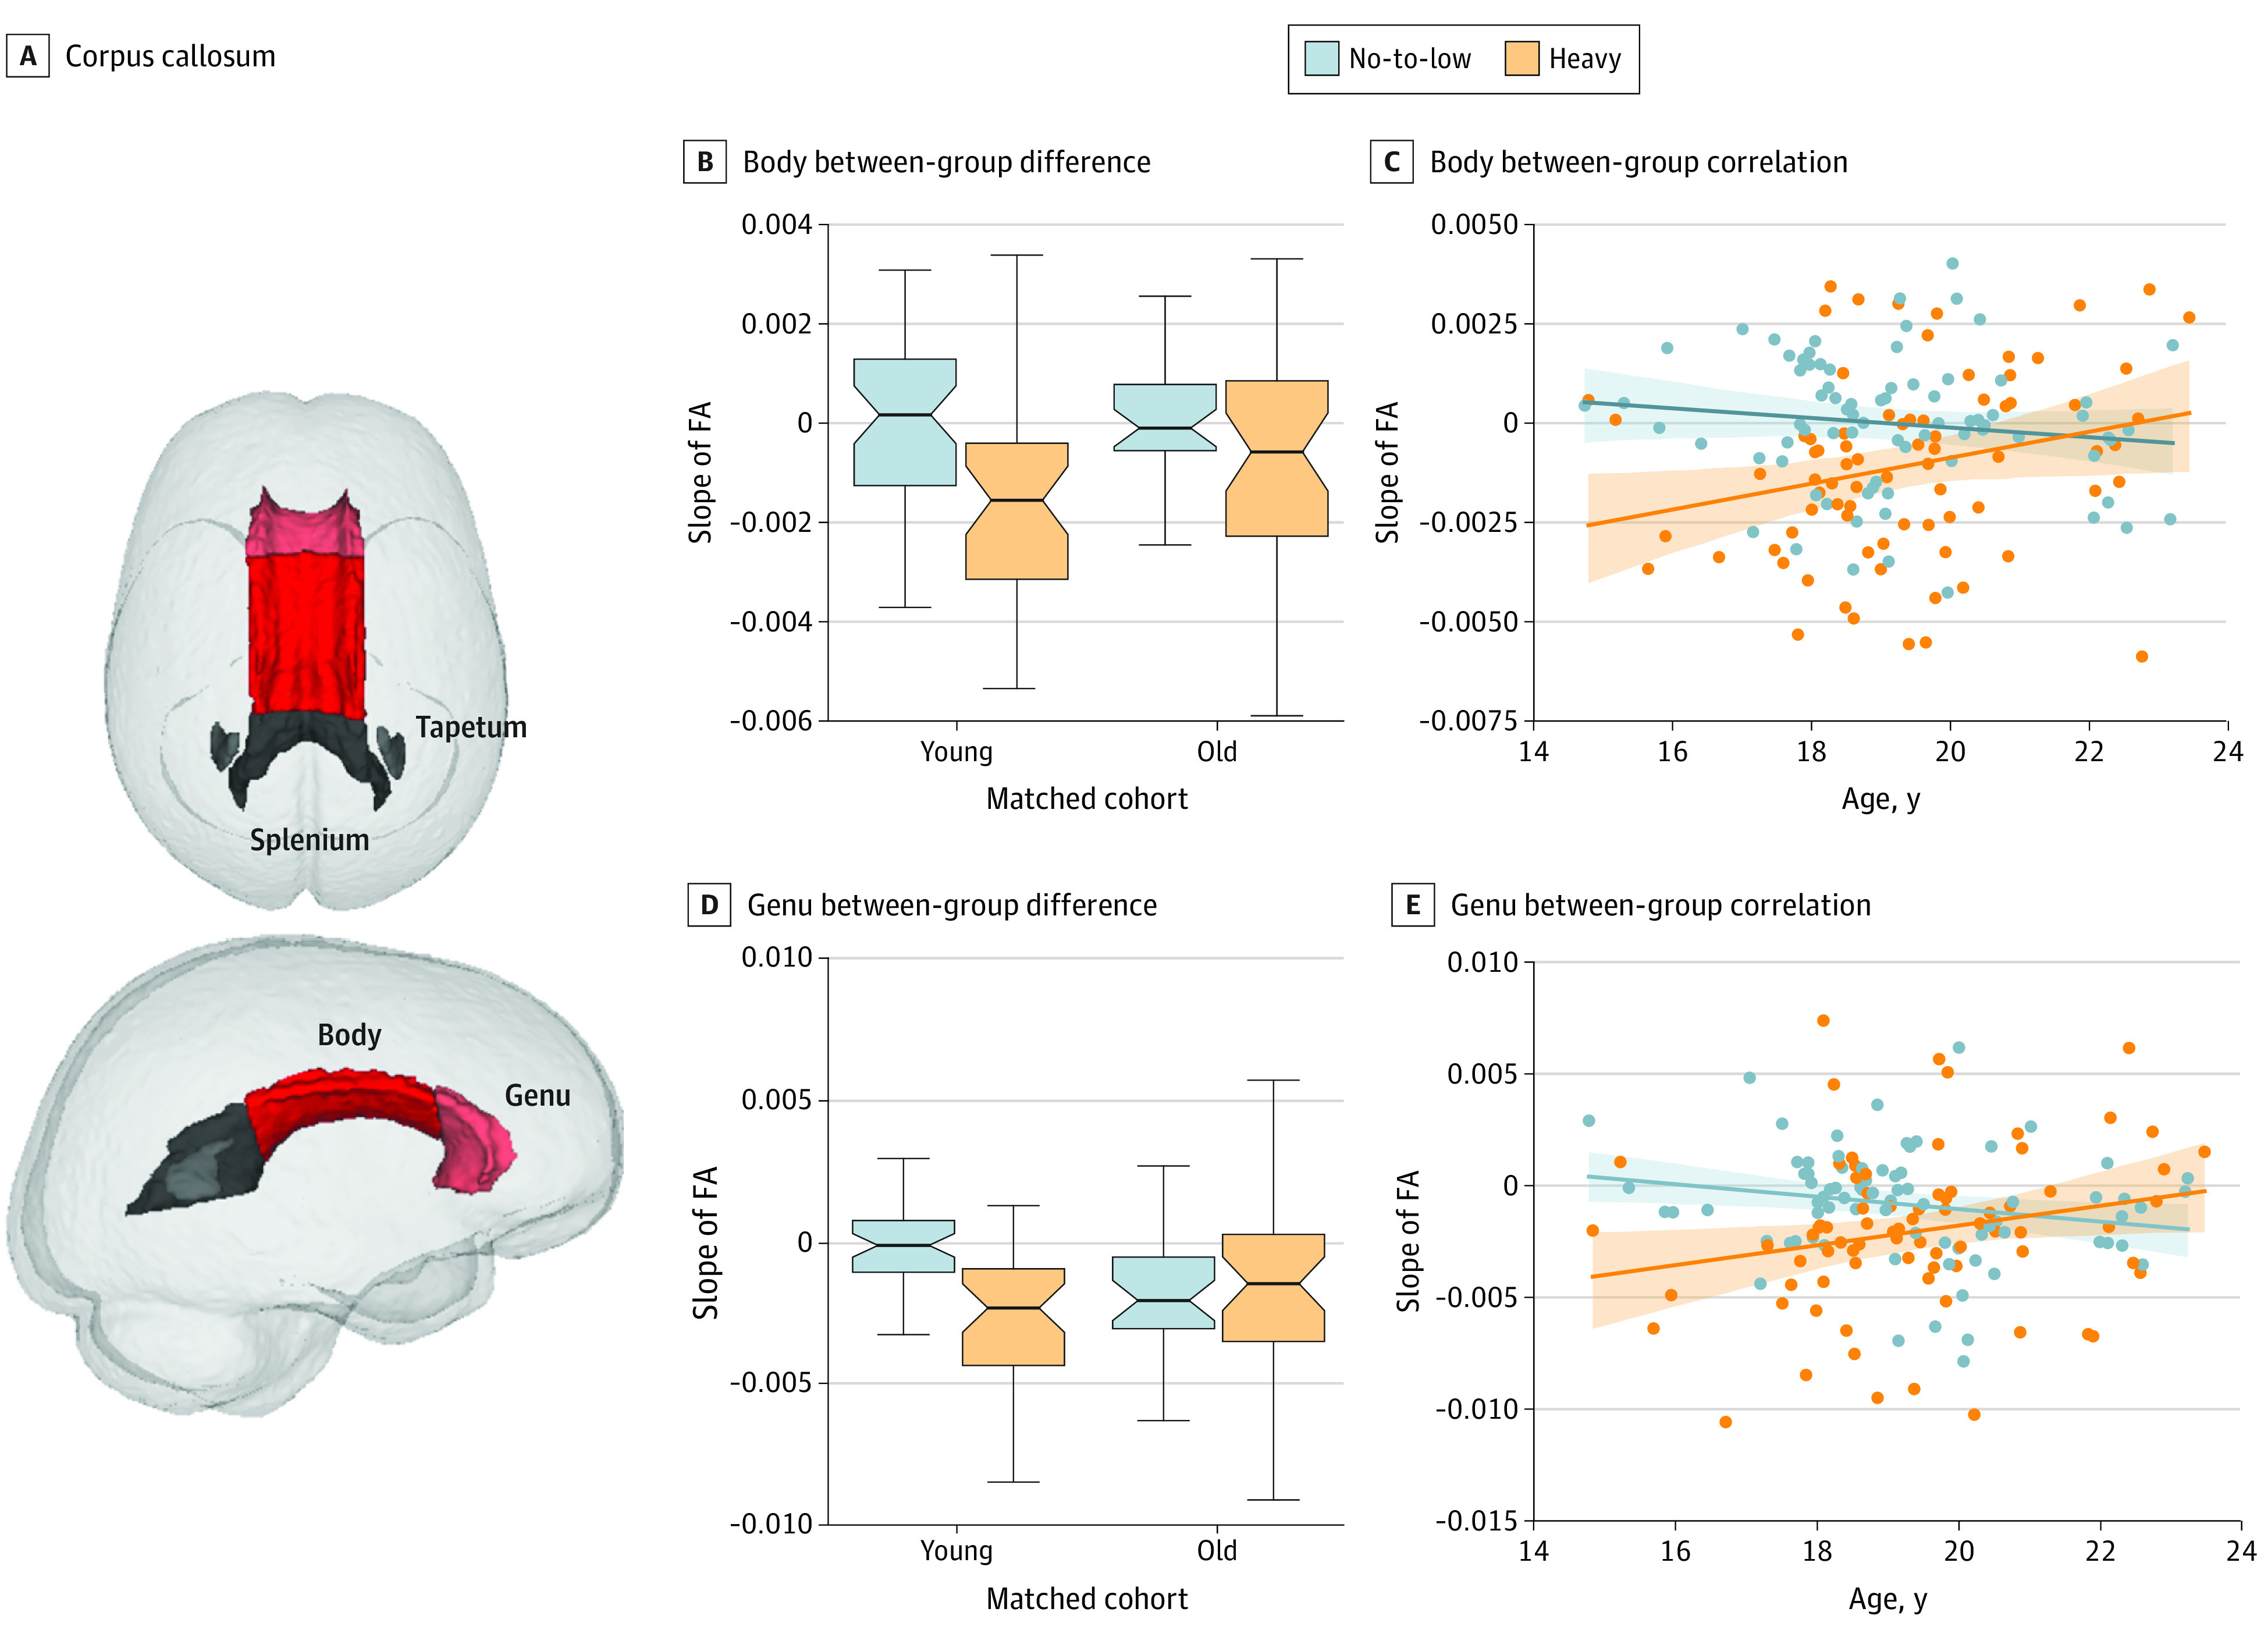
Figure 4. Alcohol Outcomes in the Genu and Body of the Corpus Callosum.

A, Corpus callosum. B-D, Significant alcohol outcome and age-drinking-group interaction were observed in the body (B and C) between-group difference and between-group correlation and in the genu (D and E) between-group difference and between-group correlation of the corpus callosum. Boxplots in B and D represent the minimum, first quartile, median, third quartile, and maximum of slope of FA. Shading in C and E represents the 95% CI for the regression estimates.
