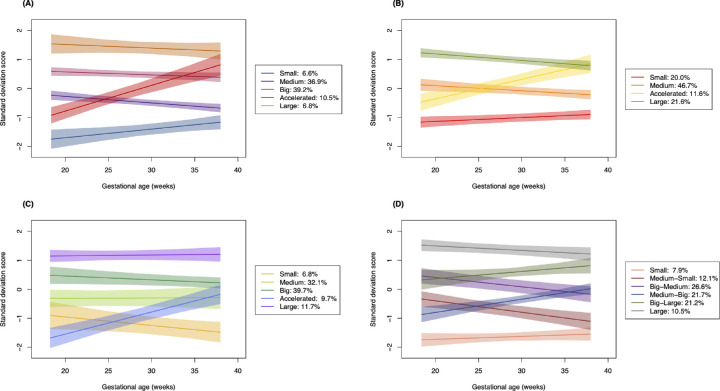
Figure 2.
Plots of the trajectory groups (estimated mean trajectories with 95% confidence intervals). (A) The five-group head circumference trajectory model (n = 439). (B) The four-group abdominal circumference trajectory model (n = 490). (C) The five-group femur length trajectory model (n = 496). (D) The six-group estimated fetal weight trajectory model (n = 429).

