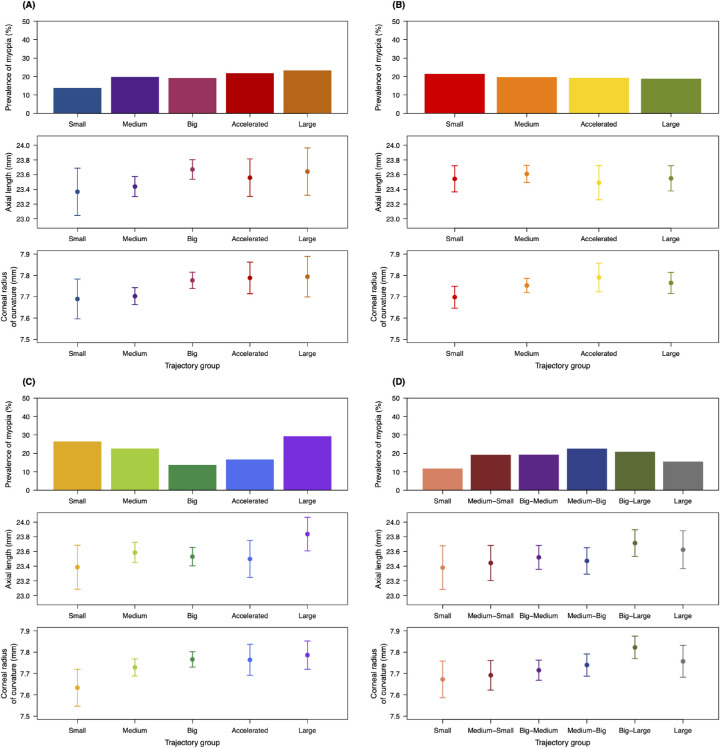
Figure 3.
Ophthalmic characteristics of participants in the trajectory groups of each model. (A) Head circumference model. (B) Abdominal circumference model. (C) Femur length model. (D) Estimated fetal weight model. Each panel presents the prevalence of myopia (top), mean axial length (middle), and corneal radius of curvature (bottom) for each model group. Bars represent 95% confidence intervals calculated in a one-way analysis of variance. For myopia, P < 0.05 in the femur length model and P > 0.05 in all other models; for axial length, P > 0.05 in all models; and for corneal radius of curvature, P > 0.05 in the abdominal circumference model and P < 0.05 in all other models.

