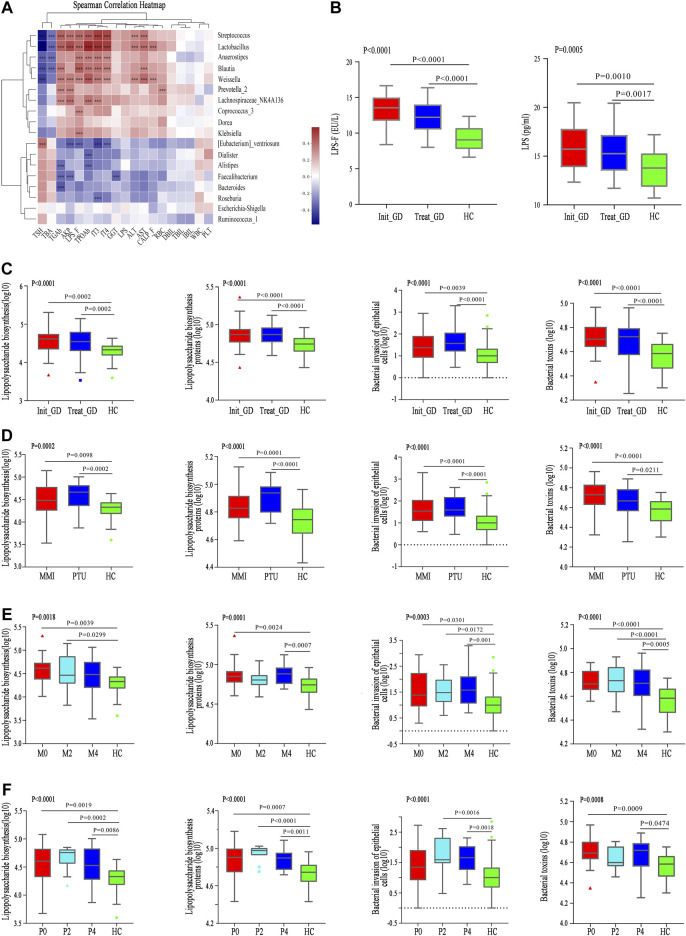
FIGURE 3.
Correlation between differential microbiota and basal indicators, and change of KEGG and gut barrier related indexes. (A) Spearman correlation analysis of 19 clinical indicators and 18 differential genera; color intensity represents the magnitude of correlation. Red, positive correlations; blue, negative correlations. *p value < 0.05; **p value < 0.01; ***p value < 0.001. (B) LPS concentration in serum (LPS) and fecal supernatant (LPS_F). (C–F) The change of pathway Lipopolysaccharide biosynthesis, Lipopolysaccharide biosynthesis proteins, Bacterial invasion of epithelial cells, and Bacterial toxins among groups with ATDs, different ATDs and different time points.

