FIGURE 7.
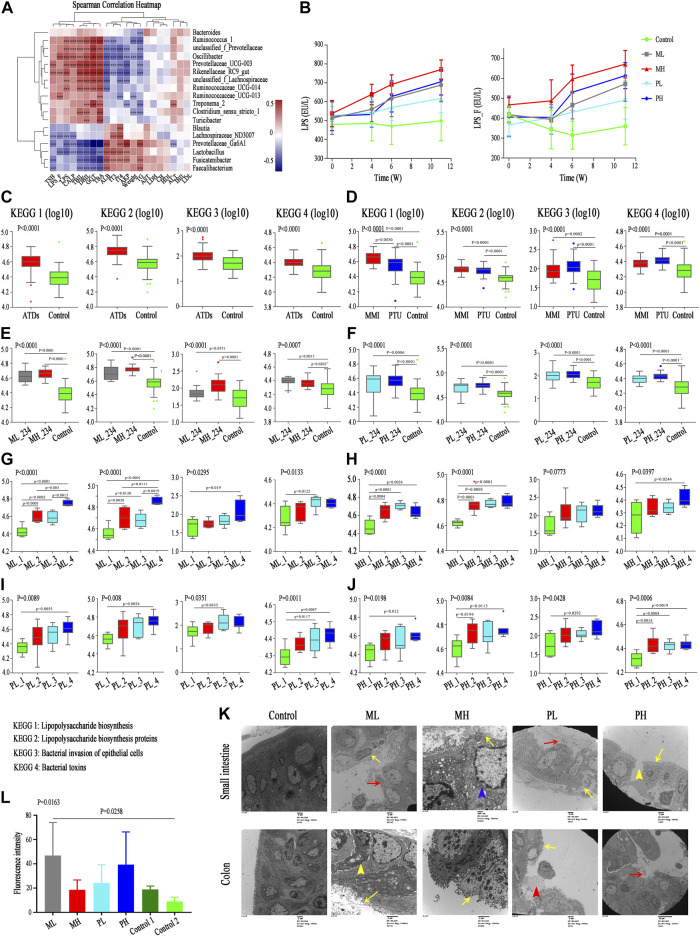
Correlation between differential microbiota and basal indicators, and change of KEGG and gut barrier related indexes. (A) Spearman correlation analysis of 21 basal indicators and 18 differential genera; color intensity represents the magnitude of correlation. Red, positive correlations; blue, negative correlations. *p value < 0.05; **p value < 0.01; ***p value < 0.001. (B) LPS concentration in serum (LPS) and fecal supernatant (LPS_F) among subgroups. (C–J) The change of pathway Lipopolysaccharide biosynthesis, Lipopolysaccharide biosynthesis proteins, Bacterial invasion of epithelial cells, and Bacterial toxins among groups with ATDs, different ATDs, different doses and different time points. (K) Transmission electron microscopy analysis of small intestine (upper) and colon (lower) among different subgroups. Yellow long arrow means epithelial villus shedding; red long arrow means intestinal epithelium shedding; yellow short arrow means cell shrinkage; blue arrow means cell swelling and red short arrow means cell debris. (L) Serum FITC-dextran levels among different groups.

