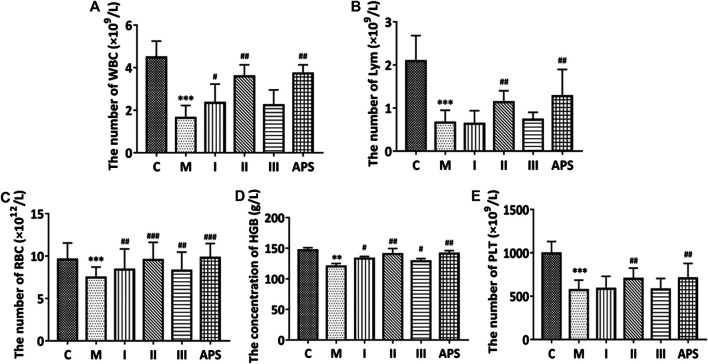
FIGURE 4.
Comparison of the routine blood indices of each group. White blood cells (A), lymphocytes (B), red blood cells (C), hemoglobin (D), platelets (E). C: control group, M: model group, I: APS-I, II: APS-II, III: APS-III. n = 6, ± s, *p < 0.05, **p < 0.01, ***p < 0.001 vs. the control group; # p < 0.05, ## p < 0.01, ### p < 0.001 vs. the model group.

